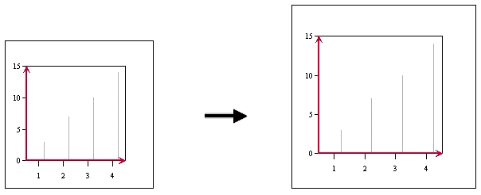
This example shows you how to adjust the size of the canvas while keeping the Chart Plot size constant in relation to the canvas.
// default canvas size is 600 pixels by 500 pixels
int width = 500; // in pixels
int height = 550; // in pixels
chart.gethCanvas().setSize( new Dimension(width, height));
To change the canvas area in the Chart Designer, go to → and change the dimensions there. Note that the canvas is always equal to or greater than the Chart Designer window size. If you want a smaller Canvas area, you must reduce the dimensions of the Chart Designer window first.
