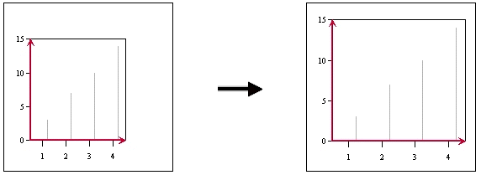
Component Layout Differences between EspressChart and Java
EspressChart describes its component layout in relative coordinates. On the other hand, Java uses layout format in terms of pixels. Due to backward-compatibility issues, the EspressChart layout format will not be changed. The issues pertaining to relative & absolute position is less relevant in Chart Designer since there is a graphical user’s interface. However, it is helpful to know how the layout format is in Chart API: the origin (0, 0) is at the lower left-hand corner of the canvas and the maximum (1, 1) is at the upper right-hand corner.
In the Java layout format, the origin is at the upper left-hand corner and the maximum pixel (maximumX, maximumY) is at the lower right-hand corner.
In the IAxis Class, the methods setMaxScale, setMinScale, and setScaleStep refer to the range and interval of the axis. Therefore, these methods would not affect the apparent length of the axis, rather, they specify the range of the axis.
The following sections discuss some examples of customization techniques relating to layout of chart components, re-sizing and data point labeling.
The default relative size of the chart plot area is 0.6 in the x dimension and 0.6 in the y dimension. If you want to adjust these ratios using the API, you can use the setRelativeHeight() and setRelativeWidth() methods.
// chart plot’s default relative size is 0.6, 0.6
IPlot chartPlot = chart.gethChartPlot();
chartPlot.setRelativeHeight( (float) 0.75);
chartPlot.setRelativeWidth( (float) 0.8);
To adjust the chart plot in the Chart Designer, simply click and hold down the right mouse button when the mouse cursor is on the chart. Drag the mouse to the right to increase the chart plot area and to the left to decrease the chart plot area. Depending on the direction that you move the mouse (either vertically, horizontally, or diagonally), the chart plot changes in one or in both dimensions.
