Normally with data drill-down, the mapping and drill options are fixed at design time. Dynamic drill-down is an additional option that allows the end user to select the mapping. All that is specified at design time is the top-level chart and the aggregation.
To create a chart with dynamic drilldown, first create the chart that you want to use as the top-level chart (for example, you can create the same top-level chart as before). Next, select → . A dialog will appear allowing you to enable dynamic drill-down.
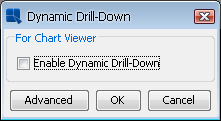
Enable Dynamic Drill-Down Dialog
Check the Enable Dynamic Drill Down box and a new dialog will surface prompting you to select the aggregation.
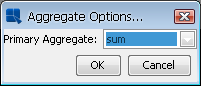
Aggregation Dialog
Options for this dialog are the same as for regular data drill-down. Once you have specified the aggregate you would like to use, click . Another dialog will surface and allow you to specify a template to use for the sub-level charts.
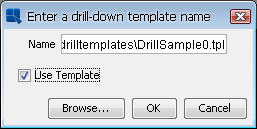
Select Dynamic Drill-Down Template Dialog
If you do not select to use a template then the sub-level charts will be generated using default appearance properties. After you have finished selecting these options, your chart will change to display aggregated data on the value axis. You can change the option by selecting → again and then clicking on the button.
Dynamic drill-down charts can only be viewed in the Chart Viewer applet. In the Chart Viewer, you can configure the next drill-down chart setting by right clicking the desktop area to bring up the pop-up menu. If dynamic drill-down is enabled and the chart still has some unused fields (columns) to plot, the item Drill Down will be displayed in the pop-up menu. Upon selecting Drill Down in the pop-up menu, you can view the current setting for next drill-down. If Category is None it means you have not configured the next drill-down chart yet. To configure the drill-down chart for next level, you must select Category. (Type, Series and SumBy can be selected once Category has been set). After you created a drill-down chart, you can navigate a drill-down chart in the Chart Viewer by left clicking on a data point to go down a level, by right clicking and selecting Back from the pop-up menu to go up a level, or by repeating the previous step to create another drill-down chart for next level.
![[Tip]](../../../images/tip.png) | Tip |
|---|---|
After traversing to a lower-level of drill-down, right clicking on a data point will navigate you back to the top-level chart. To bring up the pop-up menu, right click on the chart canvas away from the chart data points. |
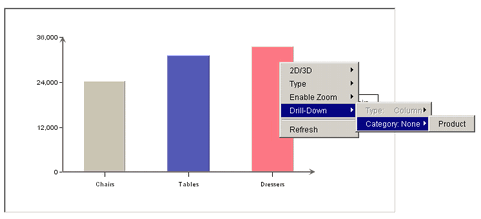
Dynamic Data Drill-Down in Chart Viewer