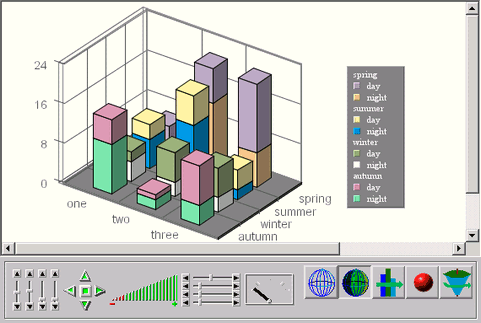
You can manipulate the chart appearance simply by using the mouse in Chart Viewer. For three-dimensional charts, Chart Viewer screen comprises of two sections: the drawing panel and the navigation panel. Only the drawing panel is visible for two-dimensional charts. Within the drawing panel, the chart itself is located on the plot area.

A Sample Chart Viewer Display
Below is a list, not by order or importance, of chart manipulations that are possible when using Chart Viewer:
Using the navigation panel, you can:
Change light position
Rotate the chart
Translate the chart
Zoom in/out on the chart
Scale the chart in x, y, z dimension
Adjust the thickness ratio of bar/line/point/pie
Start the chart animation and control the speed of the animation
Toggle between wireframe and solid mode
Draw a black outline on all edges of the chart
Perform Gouraud shading
Drag the left mouse button on the chart, main title, x, y, and z-labels, or legend to move the item
Drag the right mouse button on plot area to resize the chart
Press the Alt key and drag the right mouse button on plot area to resize the canvas
To toggle the navigation panel (show and hide), double click the left mouse button on the drawing panel
Using the mouse you can also query data points individually
Left single click on a data point to view the data associated with that point
A right single click on data provides the name of the hyperlink associated with the data point
Left double click to jump to the hyperlink associated with the data point. (Note that this creates a new browser window. Users can not use the button on the browser to return to the previous chart)
Right double click to jump back to the previous chart (if appropriate)
Use Alt+Z to specify the zoom-in parameters
Use Ctrl+R to refresh data manually
Use Ctrl+Left Click to select the bounds to zoom in and Ctrl+Right Click to zoom out