Once you select the data source, which you would like to use, and click , the next screen will present the first twenty records from the data source (With the exception of data views, which will require you to select fields and set conditions first). From this screen you can see all of the records returned by the selected source, by checking the Show All Records box.
EspressChart allows you to construct charts from multiple data sources. Once you have selected your first source, and click from the data table window, you will be presented with a dialog asking if you would like to process the current data, or select another data source.

Additional Data Source Dialog
If you select Process Data and click , you will continue on to the next step in the chart wizard. If you select Get Other Data Source, you will return to the Data Source Manager to select another data source for the chart. You can repeat this process to select as many sources as you would like.
Multiple data sources are combined sideways in the data table. This means that the columns from the second (or third, fourth, etc.) data source are placed to the right of the columns from the first data source. If the columns from one data source have more rows than another, then null values will be placed in the extra rows.
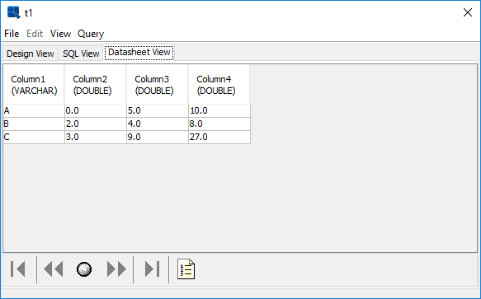
For example, assume you want to use two data sources to create a chart. The data table generated by the first source looks like this:
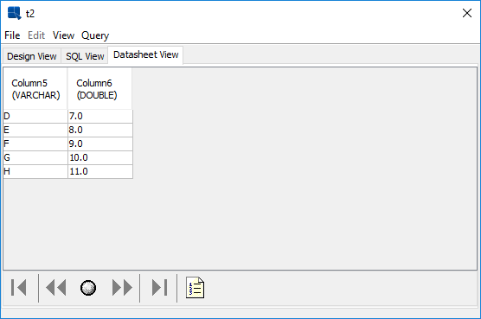
The data from the second source looks like this:
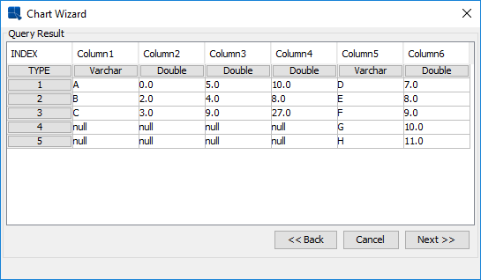
When you combine the two data sources you will get the following data table:
As you can see, the two data sources have been placed side by side. Since the second source has more rows of data than the first, additional rows of null data have been added.
![[Note]](../../../images/note.png) | Note |
|---|---|
You cannot use parameterized data sources to create a multiple data source. |
At any point during chart design, you can select to change the template’s data source. Since chart templates are saved with their data source information, you must use the option within Chart Designer to change the template's data source. Simply altering a data source in the registry will not effect the template unless you use the data source updating feature (for more on this, see Section 4.11 - Data Source Updating). To change a template’s data source, select Modify Data Source from the Data menu, or click the button on the toolbar. This will bring up the Data Source Manager, allowing you to select a new data source, or modify an existing one.
When changing the data source, you may have to re-map the data to the chart. For more information about layouts and data mapping, see Chapter 5 - Chart Types and Data Mapping.


