EspressDashboard supports two types of alerts, namely, dashboard alerts and monitoring alerts. Dashboard alerts are evaluated only on currently opened dashboards. They are not triggered when the dashboard is not open. Monitoring alerts are alerts in scheduled objects (reports, charts, maps, dashboards). Monitored alert tasks are run at certain times. You can set a time pattern or specify custom times (timing possibilities will be described later). At the time when alert monitoring task is run, alert conditions are evaluated and the monitoring task actions (i.e. Send email, upload to FTP) are run only if an alert was triggered. If no alerts in the alert monitoring task are triggered, no action is performed.
Dashboard alerts are set up for individual templates (reports, charts, maps) in the dashboard using the user interface in the dashboard builder. Alert (exception) conditions are evaluated when the templates are exported, i.e. during initial loading, auto refresh, manual refresh of the dashboard, changing parameters and resizing the template. Auto refresh is enabled every time you preview or view a dashboard. Default auto refresh interval is 60 seconds.
If an alert was triggered, color of template border will change and the border starts blinking. For templates in folders, tab header color will change and blink.
In addition, the template will have its own “native” highlighting of the values:
coloring of areas in the SVG maps
control ranges in charts
Please note that alert highlighting or blinking are visible only in Preview of the Dashboard Builder.
Alerts dialog can be accessed using this button ![]() that is in the header of every template in the dashboard .This button is only visible for templates that can have some alerts. It will not be displayed for templates that cannot have alerts (i.e. all Google maps, SVG maps without thresholds, charts without control ranges and reports without scripts with ALERT variable).
that is in the header of every template in the dashboard .This button is only visible for templates that can have some alerts. It will not be displayed for templates that cannot have alerts (i.e. all Google maps, SVG maps without thresholds, charts without control ranges and reports without scripts with ALERT variable).
After clicking the button, you will get a dialog with all possible alerts that can be watched (i.e. names of all control ranges for charts, all ranges for SVG maps or all possible values of the ALERT variable for reports).
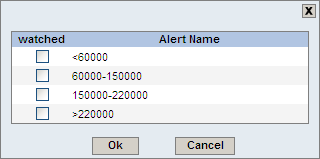
Watch alerts dialog
All the watched checkboxes will be unchecked by default, which means that no alert is watched. You can then check them and start watching the alerts. The alert name cannot be changed. It will always be read from the template.
All alerts will be joined using logical OR. If any of these alerts trigger, the dashboard alert will trigger.