The Chart Designer is a graphical user interface, launched within the Organizer that allows users to create and customize charts. The simple drop and drag style interface and extensive editing/formatting capabilities, makes chart design quick and easy.
It is important to note that in EDAB there are two ways that you can use charts. Charts can either be placed within reports or designed and run as stand-alone entities. A unique feature of charts placed in reports is that they can use the report data as their data source. In this instance, the chart cannot be deployed outside of the report.
Charts that use their own data sources can be deployed independently from reports, either in menu pages or using image URLs to embed them in web pages.
The Chart Designer interface is always loaded from within the Organizer. To start a new chart, you can click the button on the toolbar or select → . You can also start Chart Designer when creating or editing data sources in the registry. The button allows you to preview a data source and to build a chart or report. In addition, you can open the Chart Designer to edit a chart template file in the Organizer. To do so, first, select the file that you would like to open and then you can select → or right click on the file and select Open File from the pop-up menu.
If you are creating or adding an embedded chart within a report, the Chart Designer is launched from within Report Designer by either clicking on the button on the toolbar or by selecting → .
The first step in designing a chart is to select the data source from which the chart is to be drawn. The first time you select to start a new chart you will be prompted to select the data registry that you would like to use. If there are not currently any available registries (meaning that you have not created any or you do not have privileges to view any), you will be prompted to go the Data Registry Manager to create one. For more on data sources, please see Section 2.3 - Working with Data Sources
Once you have selected a registry, a Data Source Manager window will open allowing you to select, add, or modify a data source that you would like to use for the chart or report. Note that the registry will not open if you are building a chart from the registry in the Modify Data Sources dialogs.
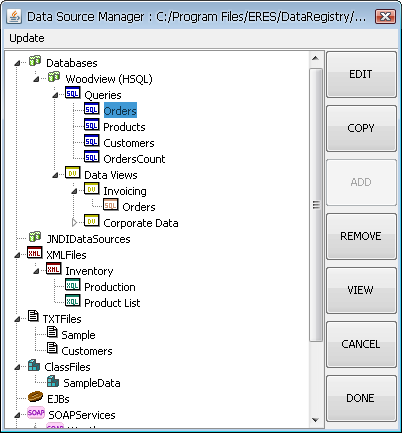
Data Source Manager Window for Chart Designer