Alerts are specified in a displayable object, namely, map, chart and report.
For Google Maps, currently there is no feature that can support alerts. So alerts are not supported in Google Maps in this version.
For SVG Maps, alerts can be specified on all thresholds in the map. You can select ranges that are critical for you. If any of the areas on the map would be in that range, alert will trigger.
If the map doesn't have any thresholds, alerts will not be available for the map.
Example:

SVG map with thresholds
You can for example say that ranges <= $90000 and $90000 - $330000 are critical and you will get alert if there are any yellow or light green areas in the map.
For Charts, you can specify alerts on control areas. Similarly to SVG maps, you can choose the ranges that are critical for you. If there are no control ranges, alerts will not be available for the chart.
Example:
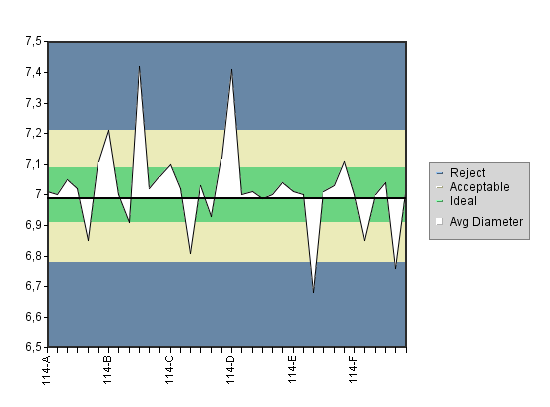
Chart with control areas
You can say that the Reject control area is critical and you will get alert whenever there is at least one data point in this (blue) control area.
Control area ranges are evaluated as left-closed, right-open intervals [start, end). In other words, the alert will trigger if the following condition is true: start <= ActualValue < end.
To insert alerts into reports, use this icon For reports, you can specify alerts in Quick Designer. Just use this icon ![]() from Quick Designer main toolbar. To learn more about adding alerts into reports, visit Section 3.10.2.4 - Alerts for Report Elements.
from Quick Designer main toolbar. To learn more about adding alerts into reports, visit Section 3.10.2.4 - Alerts for Report Elements.