Once you have selected a data source or finished building a query, you will be taken to a screen that shows the first ten records from the selected source.
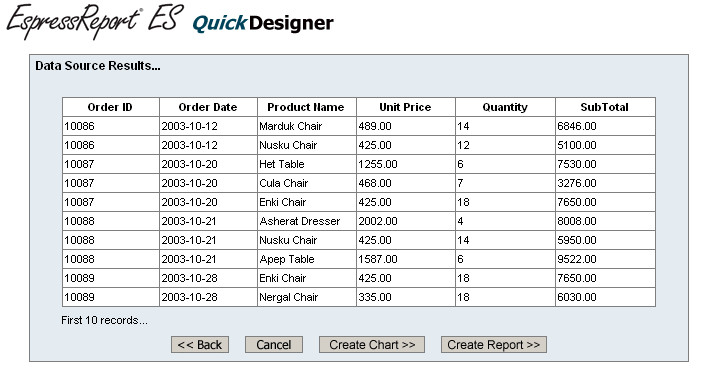
Data Source/Query Results
At the bottom of the dialog, you can select whether you would like to create a report or a chart from the data source. If you select to create a report you will go on to the report mapping options. If you select to create a chart you will go on to the chart mapping options.
If you elect to create a report, you will go to the grouping options dialog. This dialog allows you to specify certain mapping options for the report.
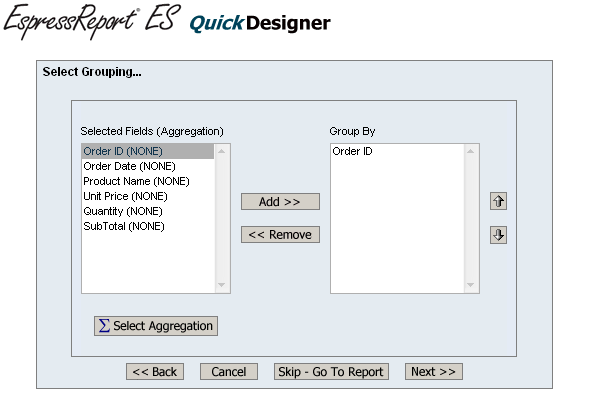
Grouping Dialog
This dialog allows you to specify whether you would like to add any grouping and aggregation to the report. In QuickDesigner you can either create a straight tabular data display (simple columnar) or a grouped report (summary break). To select a column to group by, select it and click the button. If you select more than one level of grouping you can change the nesting order using the arrow buttons on the right-hand side of the dialog.
To set column aggregation, click the button below the column list on the left-hand side. This will open a new dialog allowing you to select the aggregation for the columns in the report.
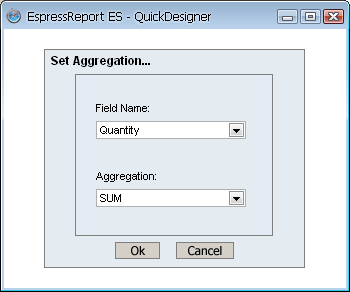
Set Aggregation Dialog
The top drop-down list contains all the selected columns for the report. The lower list contains all the available aggregation options. To set the aggregation for a column, select it in the upper list, and set the desired aggregation in the lower list. Once you have finished, click and the dialog will close. The new aggregations will be reflected in the column list.
If you do not wish to specify any aggregation or grouping, you can click the button to go directly to the report.
Once you have specified the grouping and aggregation options from your report and have clicked , you will be taken to a dialog asking you to specify a style for the report.
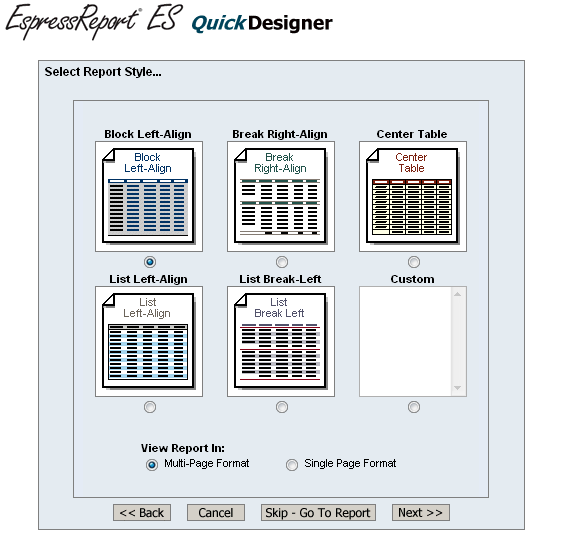
Select Report Style Dialog
The styles will apply formats to the report elements, as well as change the default attributes of new report elements. For more information about the default report styles, please see Section 3.2.6 - Additional Formatting Options.
As in Report Designer, you can also select a custom style for the report. To use a custom style in QuickDesigner, the style (.stl) file must be placed in the <ERESInstallDir>/qDesigner/styles directory. The files in this directory are shown in the drop-down list. To choose a custom style, select the radio button under the dialog and pick a style from the list. For more information about custom styles, please see Section 3.2.6.1 - Custom Styles.
In addition, you can also elect to view the report in QuickDesigner in single page or multi-page format, by selecting the appropriate option. (The report view in QuickDesigner uses DHTML format).
If you do not want to apply a style, click the button to go to the report.
If you elect to create a chart you will go to the chart mapping options dialog. This dialog allows you to select which chart type you would like to create and which fields from the data source to map to the chart elements.
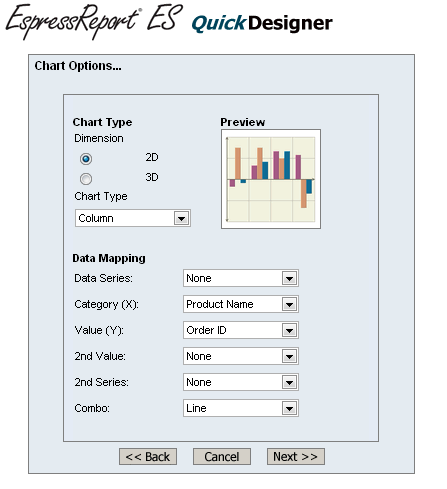
Chart Mapping Options
The first option in the dialog allows you to select between two-dimensional and three-dimensional chart types. The second option allows you to select the chart type you would like. The last options allow you to select the data mapping for the chart. For a detailed description of all available charts and mapping options, see Section 3.13 - Chart Types and Data Mapping.
Once, you have selected the type and mapping options, click to continue on to the main QuickDesigner window.
After you have gone to the main QuickDesigner window, you can change the mapping options selected for the report/chart, by clicking the Change Data Mapping button on the toolbar. This will open a dialog allowing you to change grouping/aggregation options for reports and type/mapping options for charts.