Charts provide a great means to quickly analyze and comprehend information in a set of data. However, sometimes the data being viewed is either too voluminous or too complex to be easily rendered in a single chart. One way to display this type of data is to create a top-level chart that displays only summarized data. This enables users to click through specific data points or their corresponding labels in the chart legend to see underlying data. This is the concept of drill-down. It is possible to create a drill-down effect by creating the different charts individually and using hyperlinks to link the appropriate chart to the appropriate data point or to the corresponding label in the legend. However, this approach only works well if there are a small number of data points. For example, assume you have a top-level chart with 20 data points. For one level of drill-down you would have to create 20 charts, one for each data point. Suppose that the sub-level chart has 15 data points. To add another level of drill-down you would have to create 20 x 15 charts, or 300 separate charts. To avoid this problem, EspressChart contains several different built-in drill-down mechanisms that allow you to create only one chart for each level of drill-down. All of the drill-down options are available from the Drill-Down menu in Chart Designer.
Data drill-down allows you to group and display information that is based on a single data source. The advantage to this form of drill-down is that it works with any data source. However, it does not allow you to display loosely related information because all levels of drill-down will share the same value column from the input data.
For example, assume you have the following table as the chart data:
| Category | Product | Sales |
|---|---|---|
| Chairs | Elm Arm Chair | $8,216 |
| Chairs | Pine Side Chair | $7,611 |
| Chairs | Redwood Arm Chair | $8,625 |
| Tables | Elm Round Table | $10,241 |
| Tables | Pine Oval Table | $9,663 |
| Tables | Oak Oval Table | $11,261 |
| Dressers | Oak Single Dresser | $16,442 |
| Dressers | Elm Double Dresser | $17,148 |
Using this data, you could create a top-level chart that displays total sales for each distinct product category and then create a lower-level chart that shows individual sales for each product in a category. The number of drill-down levels available depends on the number of groupings that are present in the input data.
To add layers of data drill-down to a chart, you must first create a top-level chart. In the above example, we would create a chart with “Category” mapped to the category axis and “Sales” mapped to the value axis. In a column chart, it would look like this:
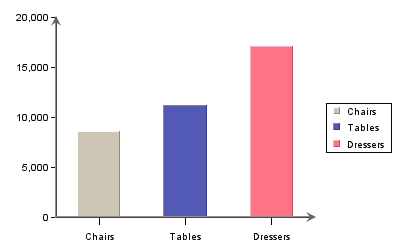
Top-Level Chart
To add a layer of drill-down, select → . This will bring up a dialog prompting you to specify the aggregation you want to use for the value axis. For example, selecting sum will display the total for each category in the top-level chart. Available aggregate functions are minimum, maximum, average, sum, count, first, last, sumsquare, variance, stddev, and countdistinct.
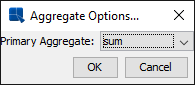
Aggregation Dialog
After you select the aggregation you want to use, click on the button. A new dialog will appear prompting you to specify a name for the drill-down chart. This name will be assigned to the chart templates that are created by the drill-down process. Note that all sub-level drill-down templates are saved in the /drilltemplates/ directory.
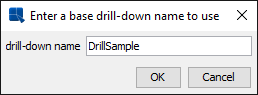
Drill-Down Name Dialog
Once you have specified a name you want to use, click on the button. You will then be prompted to specify the chart type and data mapping for the sub-level chart.
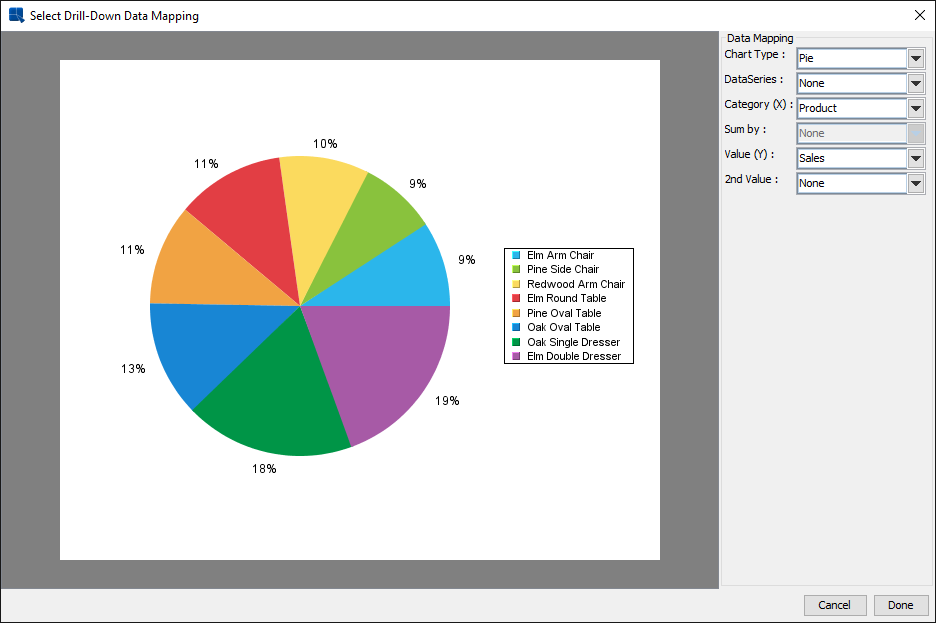
Data Drill-Down Mapping Dialog
The options in the dialog are similar to those for normal data mapping. The major difference is that the first option allows you to select a chart type. Available chart types for data drill-down are column, bar, line, stack column, stack bar, pie, area, doughnut, overlay, radar, and dial. The data mapping options will change depending on the type of chart that you select.
Once you have finished specifying the mapping options, click on the Done button and you will go back to the Chart Designer where you can customize and modify your sub-level chart. You can add additional layers of drill-down by selecting → again.
You can navigate to a particular drill-down chart by selecting → or → or by double clicking a data point. The Previous selection takes you up a level, while the Next selection goes down a level using the left-most category as the data to be drilled on. You can also go from any drill-down chart to the top-level chart by selecting → . You can customize (i.e. assign colors, add title, axis labels, background image, ...etc.) the drill-down chart in the same way as the top-level chart. Everytime you change and leave a level, you will be prompted to save the chart. Make sure that you answer if you want the attributes of the drill-down level to be saved, otherwise you will you lose all the changes.
You can insert a drill-down chart between two other drill-down charts by going to the higher level drill-down chart and selecting → . The drill-down chart that you create will be inserted between the two previous drill-down charts.
You can remove a level of the drill-down by navigating to that level and selecting → . The entire drill-down chart can also be deleted by selecting → . Selecting → brings the drill-down chart to a higher level, which is the same as right clicking and selecting Back from the pop-up menu. The Next selection brings the drill-down chart to a lower level, which has the same function as double clicking on an item in the chart.
Once you have finished creating and editing all the levels of the drill-down chart, you can save it by navigating to the top-level chart and selecting → or → .