From the Chart Designer, you can generate a number of static image exports for your chart. To export the current chart, select → , or click the ![]() button on the toolbar. This will bring up a dialog allowing you to specify options for the generated file.
button on the toolbar. This will bring up a dialog allowing you to specify options for the generated file.
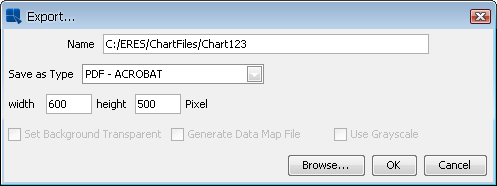
Export Chart Dialog
The first option allows you to specify a name and the file path for the generated file. You can browse to the appropriate file path by clicking the button at the bottom of the dialog. The second option allows you to select what type of export you would like. The following options are available:
GIF | EspressChart can generate GIF images. GIF has 256 color limit which keeps image file sizes small. |
JPEG | JPEG is another popular image format. It is a higher resolution image format than GIF and it is not patent protected. When generating a JPEG file, you can specify quality/compression of the file. The higher the quality, the larger the file. If you select JPEG as the export format, after clicking you will be prompted to specify the quality. The higher quality image you select, the larger the generated file size. It is recommended that with the JPEG export, you use specify a high-quality image, as the low-quality results will most likely be undesirable. |
PNG | PNG is an image format that is less popular, but can be displayed in most browsers. It is a high-quality image with a smaller file size than JPEG. It also provides transparent image background option. |
SVG | SVG (Scalable Vector Graphics) is a relatively new image format, which saves the image as vectors in an XML-based text format. Generally, you will need a browser plug-in to view these images. |
SWF | SWF is an Adobe Flash file. The flash format is vector based and allows the chart to be resized after export. Also, flash allows for high-resolution printing and produces a small file size. When selecting this export type, you can also specify the frame count (number of frames in the animation) and the frame rate (number of frames shown per second) or choose to disable the animation. |
BMP | This is a Windows bitmap format. |
WMF | WMF is the Windows Meta File format. This can be used for import/export into MS Office documents. |
This will generate the chart in Adobe Portable Document Format. The chart will be generated as a one-page PDF document. | |
XML | This will generate an XML data file containing the chart's data. This will not generate an XML chart attribute file, only the data will be written into XML format. |
XLS | Will generate an XLS (MS Excel) file and insert the chart as an image to the first XLS sheet. |
TXT | This will generate a text data file containing the chart's data. |
In addition, if your chart contains hyperlinks, you can choose to export a map file along with any of the generated images. The map file contains an HTML image map with the links for the generate chart. Map files are generated in the same location as the image file, and have the same file name. To generate a map file, check the Generate Data Map File box prior to exporting.
EspressChart allows you to use any font on the system for charts. For most image exports (GIF/JPEG/PNG) fonts will written in the generated image. However, for PDF, you will have to manually specify a .ttf (true type font), .ttc (true type collection), .pfb, or .afm file for any system font that you would like to use in the chart.
To set font mapping for PDF export, select → . This will bring up a dialog allowing you to specify font files.
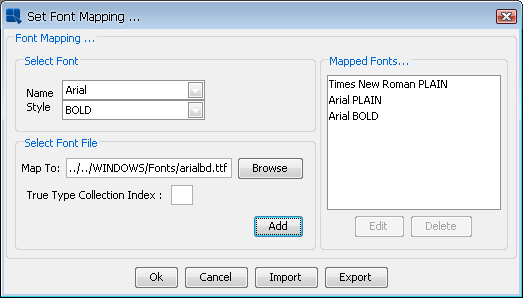
Font Mapping Dialog
For each font and style combination, you can select a specific .ttf, .ttc, .pfb, or .afm file for that font. You can either type the full path or browse to the font file. If you are using a .ttc file you will need to specify the font index in the box provided (.ttc files contain more than one font). Once you have specified the correct file, click the 'Add' button to save the mapping to the list. You can edit or delete existing mappings by selecting them in the list and then clicking the appropriate button.
You can pass the font mapping from one chart to another using the Import/Export feature. You can export the font mapping by clicking on the button on the font mapping dialog. This will bring up a dialog box prompting you to specify a file name. The font mapping will then be saved as an XML file. You can load a font mapping XML file by selecting the option from the dialog. This will bring up a dialog box prompting you to specify the XML file that you would like to import. Click on and the mapping stored in the XML file will be applied to the current chart.