The third type of a drill-down you can use for charts is a parameter drill-down. Parameter drill-down is the most flexible implementation because you can relate the data between drill-down levels in any way you like. Specifically, you do not need to use the same value element for each level. Instead, parameter drill-down uses parameterized query feature to relate various chart levels and since it uses queries, the data source for the sub-level charts must be a database or parameterized class file.
For example, using our previous scenario, rather than always looking at sales, you want your top level chart to look at aggregated sales by category (same as before), then on the next level, you want to look at sales volume for each product, and from there, you want to look at inventory levels for each product by region. This can be accomplished with parameter drill-down.
With parameter drill-down, the category value of an element you click to drill on will be passed to the sub-level chart as the parameter value. Hence, if you click on the “Chairs” column, the value of “Chairs” would be passed to the query. Therefore, anything in the database that could be filtered by category name could be retrieved.
To add and edit various layers of a parameter drill-down, select → . This will bring up a navigation window that shows various levels of drill-down.
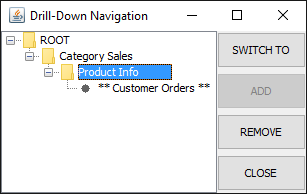
Parameter Drill-Down Navigation Window
Left-hand side of the navigation window displays the hierarchy of drill-down levels. The “ROOT” node is the top-level chart. The level you are currently editing is marked with **. To edit a different level, select it and click the button on the right-hand side. The chart will then open in the Designer. Levels of drill-down can also be removed by selecting the node in the Navigation window and then clicking on the button.
To add a new level of drill-down, select the chart under which you would like to add the layer (if you have only the top-level chart, then only the “ROOT” node will be visible), and click . You will then be prompted to create a new chart or to use an existing chart for the drill-down layer. You can use any existing chart; however, any chart for a drill-down layer must have a parameterized query as the data source. If you select to create a new chart, the Data Source Manager will reopen, allowing you to select a data source for the chart and to continue through the Chart Wizard steps.
The next step is to map the category and/or series columns from the top-level chart to the query parameter(s) in the sub-level chart. You will be prompted to do this when you select an existing chart for the drill-down layer or when you select the data source for a new chart for the drill-down layer. In either case, a dialog will appear prompting you to map the fields.
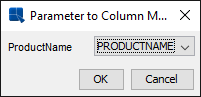
Parameter Mapping Window
Available options in the drop-down menus are based on data type. For example, if your parameterized query has string as the parameter, only fields containing string data can be mapped. Hence, it is important to consider what type of data will be passed from the top-level chart to the lower-level charts because if your category or series are not of the correct data type or if you do not have enough fields to pass to the lower-levels, the drill-down will not work correctly.
Once you correctly specify the parameter mapping, you will be prompted to specify a display name for the drill-down level. After you select a name, the sub-level chart will appear in the Designer, allowing you to customize it. You can navigate through the layers of drill-down using the Navigation window, or like data drill-down, you can double click on a data point to go down a level and right click and select Back from the pop-up menu to go up a level.