Polar Chart
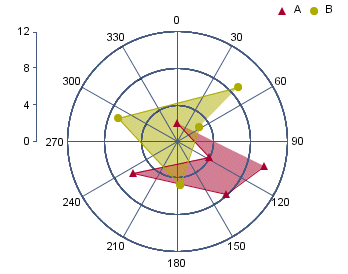
Like a two-dimensional scatter chart, a polar chart plots points on a plane. However, instead of rectangular coordinates, a polar chart plots points using polar coordinates (r, θ), where r represents the distance from the center of the circular plot and θ represents the angle of a ray emanating from the center of the plot and passing through the point. Like scatter charts, the data for polar chart coordinates must be numeric. The θ values can be supplied in degrees or radians. A third data series column can be used to separate the data points into groups.
Mapping Options for Polar Charts
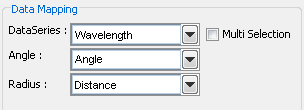
The data mapping for polar charts is similar to scatter charts. The angle and radius options allow you to select the columns whose values will make up the polar coordinates. These must both be numeric. The data series box allows you to choose a data column whose distinct values will determine the number of data series in the chart. Each element in a data series is drawn using the same set of drawing attributes, e.g., colors and markers.