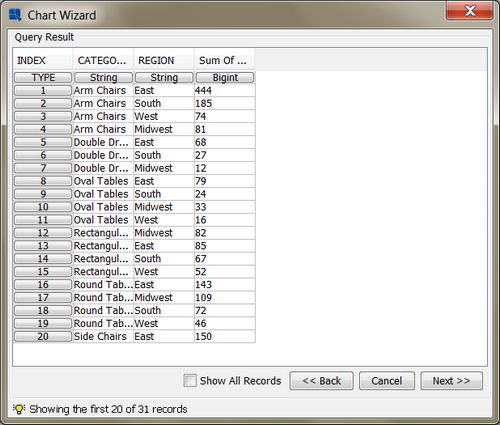
To build a chart, you must first select the data source that you would like to use. Select either the query that you created or the StartGuide text file and click the button. A new window will open showing the first twenty records of data.
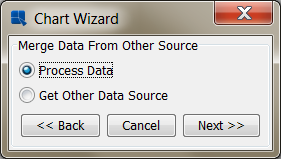
From this dialog click again. A dialog will appear asking you to process data or to get another data source. Select Process Data and click .
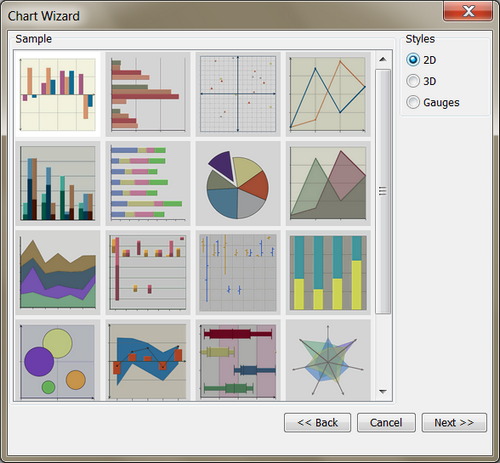
The next screen in the chart wizard allows you to select the chart type that you would like to use. You can toggle between two-dimensional and three-dimensional chart types using the radio buttons. Select a two-dimensional column chart as the type that you would like to use and click .
The next screen allows you to set data mapping for the chart. Data mapping is the process by which the columns of data from your data source are mapped to the elements of the chart. By default the first column from left to right (CategoryName) will be mapped as the data series, the second (Region) column as the categories, and the third (Quantity) column as Value. To modify the mapping, select Region as the data series and CategoryName as the categories. Leave the Value option the same.
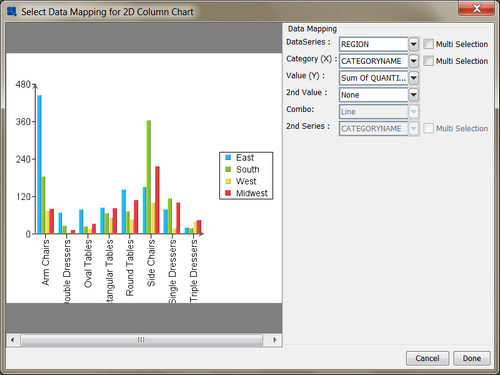
Once you have made the required changes, click on and the chart will be re-drawn in the mapping window to reflect the changes. Once you have finished setting the mapping options, click and you will go to the Chart Designer window where you can customize the chart.