Surface Chart
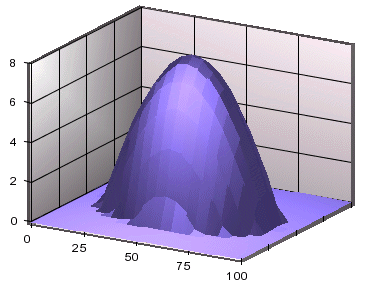
A 3D surface chart is a scientific/business chart, which uses three sets of numeric data values to form a smooth surface in a three dimensional space. For each data point, two of the three values represent the coordinates on the horizontal plane and the third value is used to determine the vertical position of a data point. Input data can be in a form of a rectangular matrix (as shown below) or arranged in three columns where each column represents an axis. In the following sample data, the top row (column header) and the left column (row header) represent the coordinate values of the axes that form the plane on which the surface will be drawn. When the chart is viewed from above the plane, you can see a grid formed by joining every four adjacent points together. A given set of data cannot plot a surface chart if this grid cannot be drawn.
Sample surface chart data:
| 0 | 20 | 40 | 60 | 70 | 80 | 100 | |
| 20 | 0 | 0 | 0 | 0 | 0 | 0 | 0 |
| 30 | 0 | 10 | 10 | 10 | 10 | 10 | 10 |
| 40 | 0 | 10 | 25 | 25 | 25 | 2 | 10 |
| 80 | 0 | 10 | 25 | 30 | 30 | 30 | 25 |
| 90 | 0 | 10 | 25 | 30 | 30 | 30 | 25 |
| 100 | 0 | 10 | 10 | 25 | 25 | 25 | 10 |
The values of the column header and the row header are not required to be equally separated because a surface chart can properly scale the horizontal distances. This dataset will create a distorted inverted cone.
A surface chart uses a set of X, Y, and Z coordinates to plot a 3D chart. The vertical axis is called Y-axis and each Y value is represented by a function of X and Z, f(X, Z). Data on XY plane (horizontal plane) simply looks like a square matrix. Surface charts do not support data series and cannot be converted to a 2D chart.
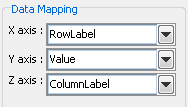
Mapping Options for Surface Charts
The data mapping for a surface chart is similar to a three-dimensional scatter chart; the X-axis, Y-axis, and Z-axis values determine the X, Y, and Z coordinates of a point respectively. However, unlike a scatter chart, surface charts do not support data series and cannot be converted to a two-dimensional chart.