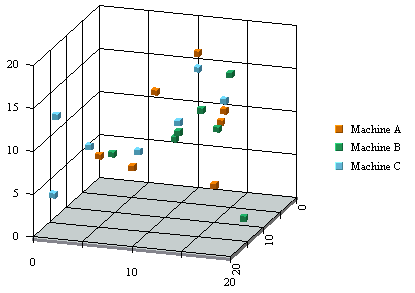
XY(Z) Scatter Chart
In an XY(Z) scatter chart, each selected row in the data table defines a point in two or three-dimensional space. Thus each column must contain either numeric or date/time values. A marker represents each point. The data columns that are in each row of the data table determine the spatial position of the marker.
Optionally, another data table column can be chosen to separate the markers into groups. Elements of each group have the same value on this column which is referred to as the data series column. Markers in the same group are drawn using the same drawing attributes; in other words, using the same shapes and colors. The X-axis scale of a scatter chart is linear. This means that unlike other chart types, the data points may or may not be evenly spaced along the X-axis.
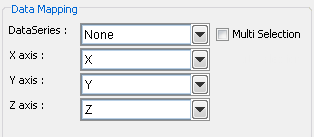
Mapping Options for Scatter Charts
In a scatter chart, the X-axis, Y-axis, and Z-axis values determine the X, Y, and Z coordinates of a point respectively. The data series box allows you to choose a data column whose distinct values will determine the number of data series in the chart. Each element in a data series is drawn using the same set of drawing attributes( e.g., colors and markers).