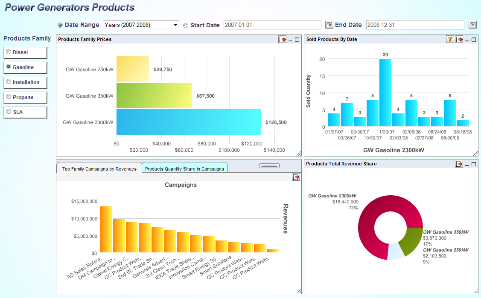
Dashboard Viewer is an applet that enables you to view and manipulate a dashboard dynamically through a web browser. Viewer reads the file (in .dsb format) as outputted by Dashboard Builder and then displays the dashboard.
The dashboard can be previewed by clicking the button ![]() on the Dashboard Builder toolbar. This will open a new window showing the dashboard.
on the Dashboard Builder toolbar. This will open a new window showing the dashboard.
The top part of the Preview interface contains a small toolbar that allows you to initiate the following actions:
 Set shared parameter(s)
 Refresh a dashboard
 Set auto refresh
 Export Dashboard to PDF (Note: All objects in dashboard including Online maps are exported, however, if map type is set to Google street map or Google satellite, map imagery will be missing in the exported file due to its license restrictions.)
 Pack/Unpack the preview toolbar
This section gives you description of options available from the preview toolbar and additional options available from the chart/report/map header bar. You can hide/show the toolbar by clicking the ![]() /
/ ![]() icons.
icons.
- Set Shared Parameters:
To set shared parameters, click the button
 on the preview toolbar. After you click the button, the shared parameters dialog will then appear. The dialog allows you to specify values for shared parameters.
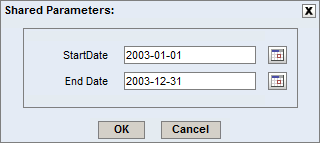
Set Shared Parameters Dialog
Note that you can use calendar for specifying date parameters. To open the calendar, simply click the button
 in the shared parameters dialog.
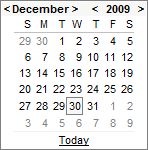
Calendar
Once you finish specifying the shared parameters, click the button to save the changes. You will be taken back to the Preview.
- Auto Refresh:
If you want your dashboard to be refreshed periodically, click the button
 on the preview toolbar. After you do so, the Auto Refresh dialog will then appear. You have to check off the AutoRefresh checkbox to enable the auto refresh feature. The dialog allows you to set the refresh interval in seconds. For example, if you specify the refresh interval for 10 seconds, the dashboard will refresh every 10 seconds.
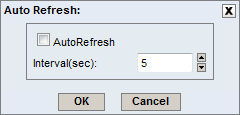
Auto Refresh Dialog
Once you finish setting up the auto refresh options, click the button to save the changes. You will be taken back to the Preview.
In addition to the options on the preview toolbar, there are additional options available for a chart/report/map that can be triggered by clicking the small buttons in the chart/report/map header bars.
| Filter: This option will open a new dialog that allows you to specify additional filters/parameters for the chart/report/map, if it has parameters that aren't associated with one of the dashboard's shared parameters. 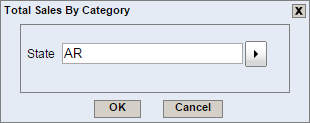 Dashboard Filter Chart/Report/Map Dialog You can select parameter values in this dialog. Once you complete your selection, click the button. The dashboard will refresh and the chart/report/map will reflect the new parameter values. |
| Change Chart Type: This option will open a new dialog that allows you to change a chart type. The chart type is changed only in the Preview. It is not possible to save the changed view of the chart, but you can export it. 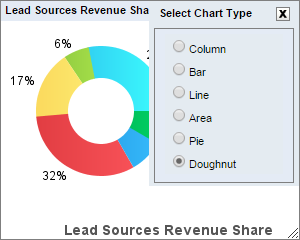 Select Chart Type Dialog |
| Export: This option will open a new dialog that allows you to export the chart/report/map in a variety of formats. For charts the following dialog is displayed: 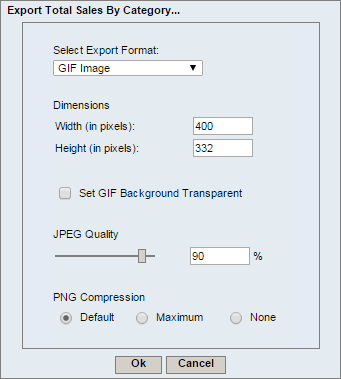 Dashboard Export Chart Dialog The first option allows you to specify the format in which to export the chart. The available formats are GIF, JPEG, PNG, PDF, SVG, Excel Image (XLS), Flash, Text Data File, XML Data File and MAP Data File (HTML Image Map). The second option allows you to set dimensions of the exported image. By default, these will match the canvas dimensions of your chart. The last set of options allows you to set some image type-specific options. You can set the background transparent for GIF files, quality for JPEG files, and specify encoding for PNG files. For more information about chart export options, please see Section 4.1.6.2 - Exporting Charts. Once you finish specifying the options for exporting the chart, click the button. A new window will open containing the exported chart. For reports the following dialog is displayed: 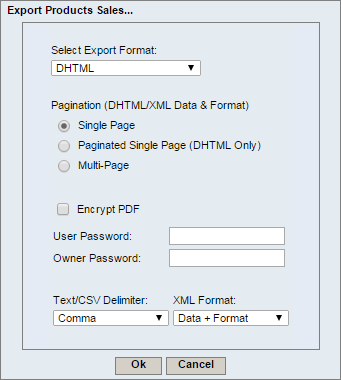 Dashboard Export Report Dialog The first option in the dialog allows you to specify in which format you want to export the report. Available options are PDF, CSV, Excel (XLS), Excel 2007 (XLSX), DHTML, text, XML and rich text. Other options allows you to set single or multi-page export for DHTML and XML exports. You can enable encryption for PDF format. For text export you can select to use the delimiter and for XML export you can select whether to export only report data, or XML description of the report and data. Once you finish specifying the options for exporting the report, click the button. A new window will open containing the exported report. Online Maps and SVG Maps support only one export format, PDF, so no export format settings dialog is displayed for maps. Please note that Online Maps cannot be exported if Google street map/Google satellite is used as map type, due to license restrictions. In this case, map imagery will be missing in the exported file. |
| Maximize: This option maximizes the report/chart/map. |
| Minimize: This option minimizes the report/chart/map (only template header bar is visible). |
| Restore: This option resizes the report/chart/map to its original size. |
