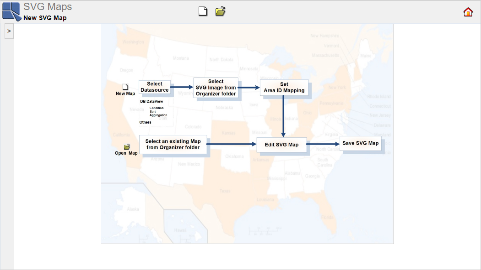
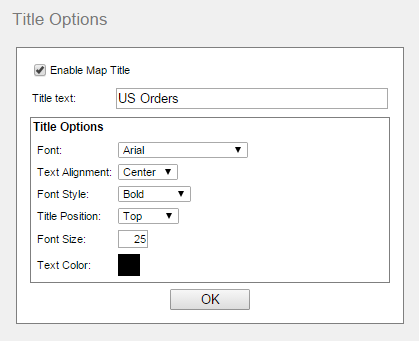
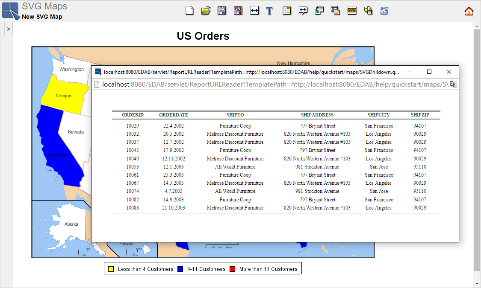
Unlike Online Maps, SVG Maps do not use map points. They use map areas. The map areas can be colored according to some values from the map data source. Coordinates of the map areas are defined in SVG map image. For more information see Section 5.3 - SVG Maps.
To create a SVG Map, go to the EDAB Start page and click the link labeled SVG Maps. You can create a new SVG map or open some existing SVG map.
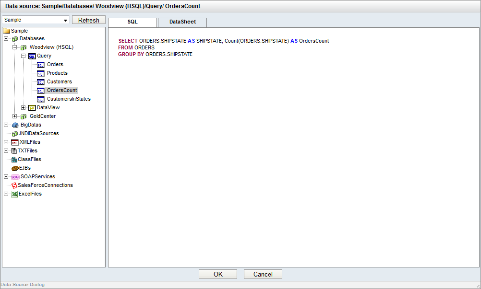
Click the ![]() button on the toolbar. You will be taken to the Data Source Dialog, where you can select a data registry and a data source for a new SVG Map. Select the Sample data registry (the left top corner of the window). Open the
button on the toolbar. You will be taken to the Data Source Dialog, where you can select a data registry and a data source for a new SVG Map. Select the Sample data registry (the left top corner of the window). Open the Databases/Woodview (HSQL)/Query node, and select the OrdersCount query.
You can see records of the data source file in the DataSheet tab. Then click to close the Data Source Dialog.
The next dialog allows you to select a Map Image. Map Images are SVG image files with data structures containing geographic data(see Section 5.3.3 - Area ID Mapping for more information about required image format), and must be inserted into the Organizer before they can be used.
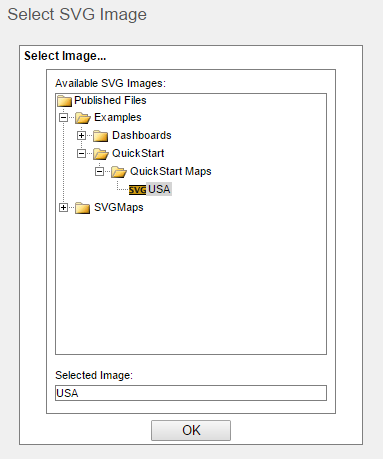
Select SVG Image Dialog
The Select SVG Image dialog contains a tree showing all Projects, Folders and SVG images inserted in the Organizer. Open the Examples project, then the QuickStart and the QuickStart Maps folder. You should be able to see the SVG image named USA in the QuickStart Maps folder. Select it and click .
Now, you can set the connection between the data source and the SVG image. This is done by assigning a data source field to the SVG map Area IDs (see Section 5.3.3 - Area ID Mapping to learn more about area ID mapping). In this case, we have a map of the USA with state name abbreviations in its Area IDs. So we want to assign a field containing the same type of data, which is the SHIPSTATE field. Set the Available columns drop-down menu to SHIPSTATE and click .
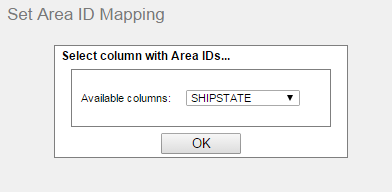
Select Column with Area IDs
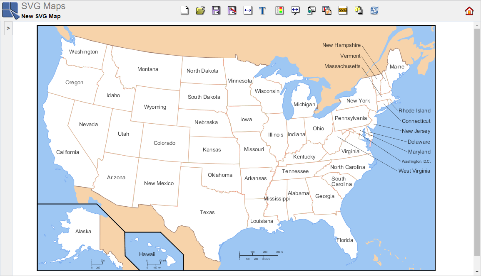
SVG map will open (Set Area ID Mapping dialog is colapsed on the screenshot).
As you can see, right now we have only the basic map with no data highlighted. There are two ways of adding data to the SVG Map: Thresholds and Drilldowns.
Thresholds allow you to configure rules for coloring map areas according to its value in a particular data source field (see Section 5.3.4.5 - Thresholds).
To set thresholds, click on the ![]() icon on the toolbar. First of all, you have to select a data source column containing numerical data that you want to report. We will use a column labeled as
icon on the toolbar. First of all, you have to select a data source column containing numerical data that you want to report. We will use a column labeled as ORDERSCOUNT, which holds information about number of orders made in a particular state.
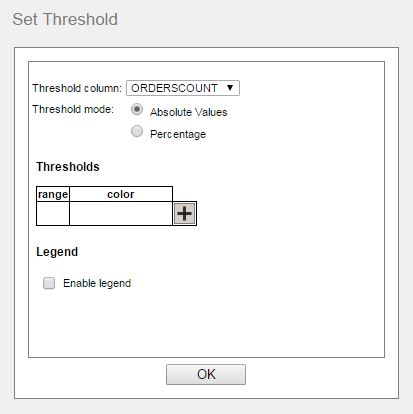
Set Threshold Dialog
Next, you can add some threshold value(s) in actual values, or percentage unit. We will use actual values for our example. Click on the ![]() icon next to the blank field labeled as color. You will be prompted to enter threshold value, which can be done by two ways – you can type it manually into the text field or you can select the value from the drop-down menu. (There are three ways to enter threshold values for percentage units. The third way is to enter a number of intervals.) Select the value
icon next to the blank field labeled as color. You will be prompted to enter threshold value, which can be done by two ways – you can type it manually into the text field or you can select the value from the drop-down menu. (There are three ways to enter threshold values for percentage units. The third way is to enter a number of intervals.) Select the value 4 from the drop-down menu and confirm the dialog by clicking . Click on the ![]() icon once again, and choose the value
icon once again, and choose the value 11 from the drop-down menu and click . EDAB has automatically set the ranges between values you added.
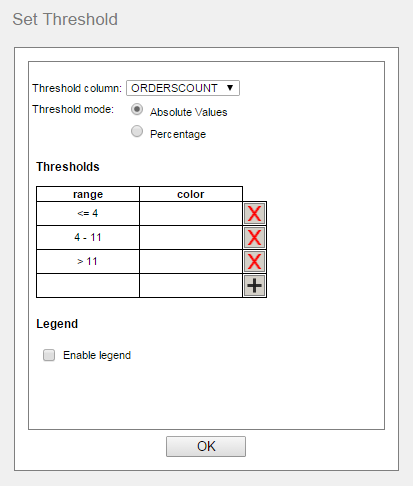
Setting Range
You can set color for each of the intervals. Click on the white color field next to the <=4 range. Click on some yellow field in the swatches color table and click . Color of the <=4 range has changed to yellow. Click on the color field next to the 4-11 range, choose a blue color and click . Click on the color field next to the >11 range, choose a red color and click . The Set Thresholds dialog should look like the one on the following screenshot:
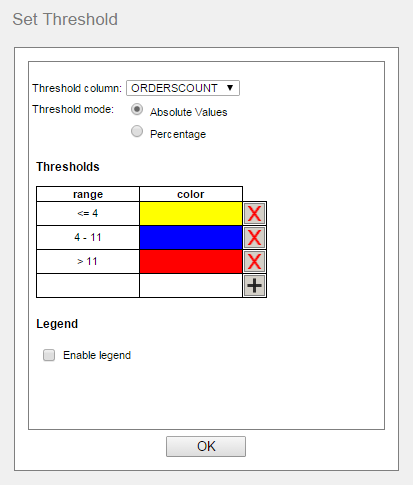
Setting Color
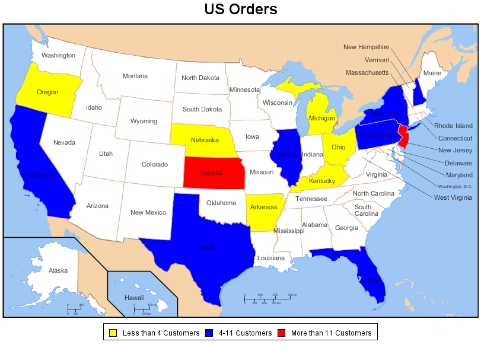
Confirm the dialog by the button. Areas of some states will be filled with the colors you previously set. Without a legend, it can be unclear what the colors mean. So lets create one. Select the Enable legend option in the Set Threshold dialog. The Thresholds table has changed. It has one more column now labeled as legend. You should be able to write into the legend field. Fill in the column according to the following screenshot.
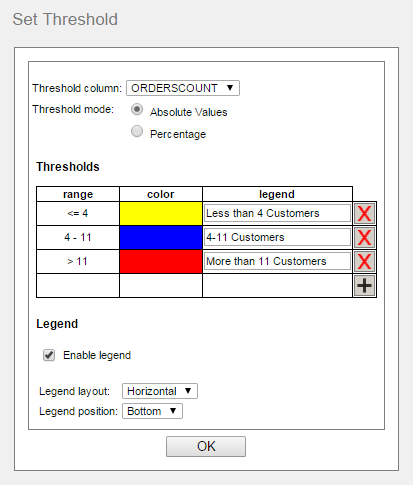
Set Thresholds- Legend
Set the Legend layout drop-down menu to Horizontal and set the Legend position to Bottom. Click . Then, without map title, you have the same SVG Map image shown in the begining of this part.
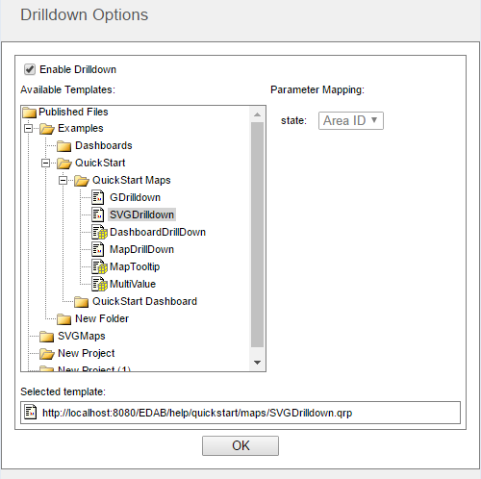
Click on the ![]() icon on the toolbar. Select the Enable Drill-Down option. Organizer structure will show up in Available Templates treeview. You will be able to see only folders and parameterized reports, charts and maps inserted into Organizer. Open the
icon on the toolbar. Select the Enable Drill-Down option. Organizer structure will show up in Available Templates treeview. You will be able to see only folders and parameterized reports, charts and maps inserted into Organizer. Open the Examples/QuickStart/QuickStart Maps folder and select the SVGDrilldown report. Click .
When you click on a colored state area, a drilldown report should open in a new window.
To save the SVG Map, click on the ![]() icon on the toolbar. Type
icon on the toolbar. Type OrdersSVGMap into the Enter Map Name text field and select the QuickStart Examples folder from the Organizer treeview.
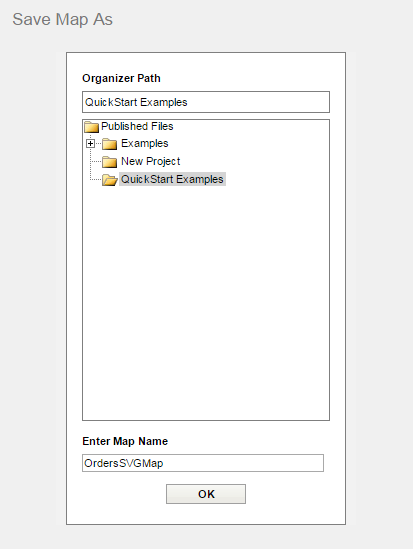
Saving Map
