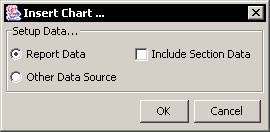
To create a chart, you can select Insert Chart from the Insert menu or select the icon on the toolbar. A small rectangle will follow your cursor around the Design window. Position the cursor where you would like to add the chart and click. This will bring up a dialog prompting you to specify data source options for the chart.
The following options are available for obtaining a data source for your chart.

Chart Data Options
- Report Data:
This will plot the chart using the data contained in the report. This data includes all of the report columns and computed columns that have been added using the report functions. When using report data for the chart you also have the option to include section data. This will take any formulas or labels from the report section in which the chart is placed and make them available to the chart. Data for labels and formulas is imported as additional columns to the chart input data. The cell ID is used as the column name.
However, when you use report data, the chart cannot be deployed independently from the report and certain charting features like time-based zooming and histograms are not available.
- Other Data Source:
This will allow you to select a different data source than the report data. If you select this option, you will be returned to the Data Source Manager window where you can create/select a data source for the chart. You can use data from any source as you can for a report. For more information about data sources, please see Section 1.3 - Working with Data Sources.
When you use an independent data source the chart can later be deployed independently from the report. Also, all of the charting features are available. Note that some features like drill-down are only functional when the chart is deployed independently from the report.
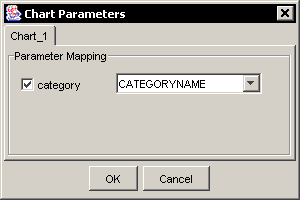
If you use a parameterized query as the chart data source, by default it will run with default values when the chart is run in the report. However, you can use the chart parameter linking feature for the chart to retrieve its parameter values based on column values in the report. This feature works in the same manner as the sub-report linking feature described in Section 1.11.4 - Linked Sub-Reports. To link a parameterized chart to a column, first insert a parameterized chart into a report. Then select Chart Parameter Mapping from the Data menu. This will bring up a dialog allowing you to map column fields from the report to query parameters in the chart.

Chart Parameter Mapping Dialog
The dialog contains a tab for each parameterized chart. Each parameter in the chart can be mapped to a different column field in the report.
If you have selected to use an independent data source for the chart, you can use multiple data sources to build a composite table as you can with report. The feature works in the same manner as in the report wizard. For more information, please see Section 1.3.8 - Data from Salesforce.