Monitoring is supported for dashboards and also for individual reports, charts and maps (let’s call them monitored objects). The monitored objects are checked in given time intervals and notifications are sent if alert occurs in some of the monitored objects. This is done in background, so the notifications are sent even if the monitored object is not viewed.
The user interface to set up monitoring is a simple wizard dialog. If the monitored object has parameters, user can set up several parameter sets. Monitoring has many options for testing intervals (e.g. one time, time interval, fixed days, etc.). Monitoring is not supported for drilldowns.
Administrators and designers are the only users who can set up monitoring (only for objects they have read access to). They can also select recipients of notification emails. Viewers are not allowed to set up monitoring.
Alert notifications are sent via emails. Exported templates can also be uploaded to FTP. Alert notification can be sent every time an alert occurs or it can be send only when alert starts (i.e. if alert wasn’t triggered during last check, but it is triggered during current test).
You can set email subject and body. They have to be the same for the entire monitoring (for all templates, alerts and parameter sets). Body of the notification email can contain some variables that will be substituted during runtime. List of these variables will be detailed later (Section 10.4.3.1.1 - Email Delivery Options).
You can set different recipients for different templates and different parameter sets. It is not possible to set different recipients for different alerts in one template. If you want that, you have to create another alert monitoring task (you can add as many tasks as you want).
If some of the monitored objects are not available, or their data sources are not available, or if there are any other problems with exporting the monitored objects or alert evaluation (e.g. watched control area was removed), the user can be notified with failed emails.
You can set failed email subject and body. Recipients are the same as for the notifications. Error log (with stack traces) can be sent to a selected user (typically admin). Failed emails dialog will be described later (Section 10.4.3.1.1 - Email Delivery Options).
To set up new alert monitoring task, please use the following steps.
- Launch the Create alert monitoring wizard -
first of all, launch Organizer and select at least one file you want to monitor. You can also select multiple files from single directory, but you don't have to select all files you want to monitor at once because you will be able to modify the file list later (and maybe add more files from different organizer folders if needed). Then you have two options: either right-click on one of the selected files and then choose the Set alert monitoring option from the pop-up menu. Or you can click Monitoring (in the main menu) and then select Set Alert Monitoring. Both methods will open the first step of the Setup alert monitoring wizard.
- Select alerts -
Select the templates you want to monitor in the task. You can select any dashboard, stand-alone report, chart or map.
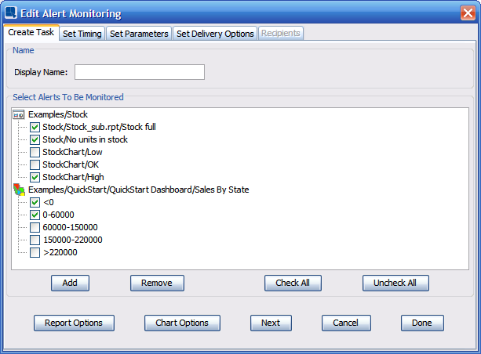
Create monitoring task dialog
The monitored template list is a tree.
The first level of the tree is the selected templates (before the dialog was open) or templates added using the button. The leaf nodes are available alerts (for their parent node). You can check alerts that should be monitored. You have to select at least one alert for each template. If you don't want to monitor any alert of a monitored object, remove the object by selecting it and clicking the button.
If the selected template is dashboard that already have some dashboard alerts defined, the checkboxes are initialized according to the dashboard alerts (the alerts that are watched in the dashboard are checked). If the selected template is not dashboard, all the checkboxes are unchecked by default.
Following two buttons allow you to set export format. Monitored templates will be exported to this format in case an alert was triggered. Also if you select additional delivery options like email or FTP delivery (will be described later), templates will be delivered in this format.
- Report options -
shows dialog allowing you to set report export format. For reports you can select DHTML, PDF, CSV, Excel (XLS), Excel 2007 (XLSX), text, rich text, or XML. Additional options allow you to select single page or multi-page exporting for DHTML and XML. The button allows you to set format-specific options for the exported file. For DHTML you can set single or multi-page exporting. For DHTML you can also specify which CSS options to use. For PDF you can set encryption, and for text you can specify the delimiter.
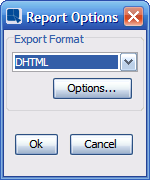
Report Options Dialog
- Chart options -
shows dialog allowing you to set chart export format. For charts you can select JPG, GIF, PNG, PDF, SVG, or FLASH. Other options allow you to specify PNG compression, set JPEG quality, and specify background transparency for GIFs. You can also enable and configure Flash animation if the image depiction should be animated. You can also specify the size of the exported image.

Chart Options Dialog
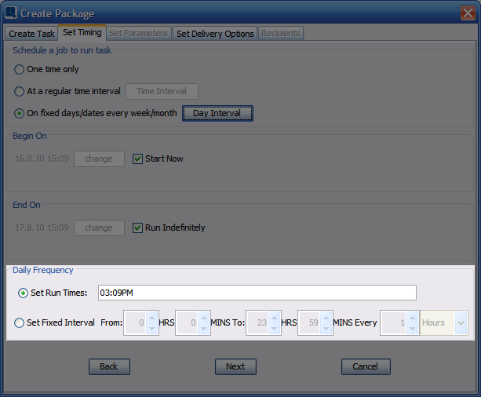
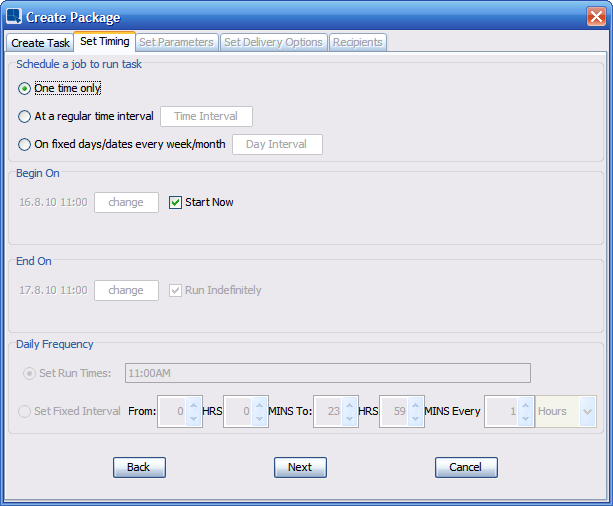
- Set timing –
allows you to set a time pattern of the alert monitoring task.
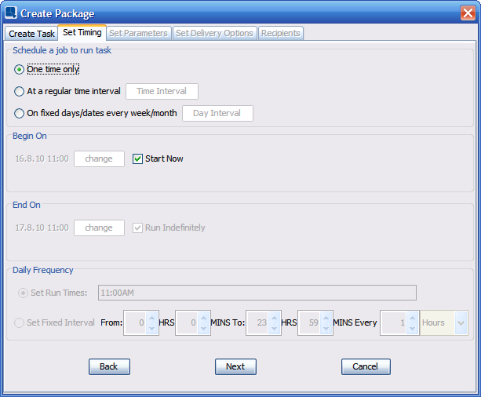
Set timing dialog
You have following timing options:
- One time only -
task is run one time only at pre-defined time. You can choose when the task will be run using the Begin on option (will be described later).
- At regular time interval -
alert monitoring task will be run at fixed intervals for a pre-defined period of time. For example: you can set the task to be run every X hours (or minutes, days, months...) from Begin on to End on time and date. When you select this option, the Set time interval dialog pops up. This dialog will be described later.
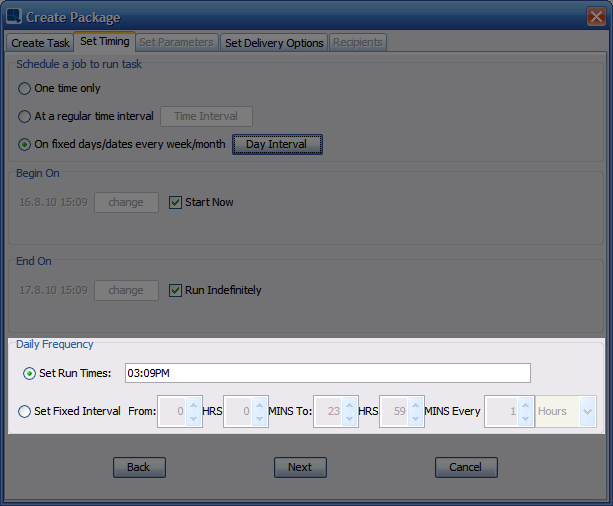
- On fixed days/dates every week/month -
If you need to run your task irregularly, this option should do the trick. It allows you to run the task on certain week day(s) (for example: every Monday and Friday), or certain days of the month (for example: every month's 1st). This is set in the Set fixed days/dates Interval dialog which pops up when you select the option. Also, when you select this option, the Daily frequency section is enabled. These two dialogs will be described later.
You also need to set when the task should start running and when it should stop. You can do that using the following options:
- Begin on -
allows you to set when the task will start running. By default, the Start now option is enabled. It means that the task start time and date will be set few minutes in the future thus the task will start running immediately after you're done configuring it. If you don't want the task to start immediately, uncheck this option to pick the start time and date from a calendar. You can access the calendar by clicking the button (which is available only when the Start now option is disabled).
- End on -
controls when the task will end. This option is very similar to the Begin on option. The only difference is that the Start now option is replaced by Run indefinitely option. If you choose this option, the task will never stop unless you stop it manually. Or you can unselect this option and pick the End on time and date manually from a calendar.
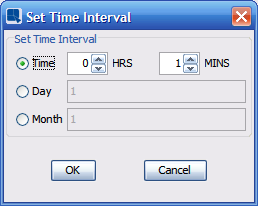
Set Time Interval Dialog
This dialog is enabled only if the At regular time interval option is selected. First of all, choose a time unit (namely: hours and minutes, days or months) that suits your needs. Then enter a number of the time units that should be waited for between each task runs.
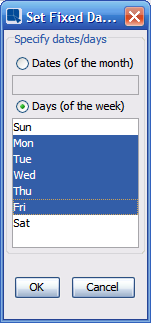
Set Fixed Days/Dates Dialog
This dialog is enabled only if the On fixed days/dates every week/month option is selected. First choose whether you want to run the task on a weekly basis, or on a monthly basis. Then select days of the week or month task should be run on. After you're done setting this dialog, click and proceed to the Daily frequency settings.
Daily frequency settings
After you have set the days of the month/week you want the task to be run on, you have to set when exactly should it be run on those days. That can be done in the Daily frequency section. You have two basic options:
- Set run times -
allows you to manually enter the run times. You can add as many values as you want. You can use 12-hour or 24-hour format. Individual values are comma separated. For example: 08:05AM, 11:15PM, 22:35
- Set fixed interval -
use this option to run the task periodically from the From: time to the To: time every X hours/minutes. To set the times, you can use up and down arrows or you can enter the value manually (click in the field and type a number). If you enter an incorrect time (for example: 11:65), the value will be marked with red color. Correct values are marked with green color.
Once you have finished specifying the periodicity, click to continue with the schedule wizard.
- Set parameters –
this step is skipped if there are no parameters in the selected templates. If you have selected to monitor a report, chart, map or dashboard that contains parameters, the next tab will appear allowing you to set the parameter values you would like use.
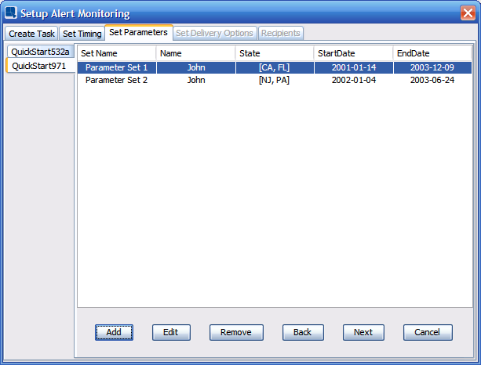
Set parameters dialog
To add a set of parameters, select the button. This will bring up the parameter prompt dialog allowing you to select the set of parameter values you would like to use. Once you have selected a parameter set, your choices will appear in the dialog. You can add as many different combinations of parameter sets as you like. A separate file will be generated for each set of parameters you specify. Alerts will be evaluated separately for each parameter sets. Only the templates that triggered some alerts will be sent in the notification email or uploaded to FTP.
You can also specify a name for each parameter set by double clicking on the first column. The name specified here will be used in later dialogs to help you organize your recipients.
Once you have specified all the parameters, click the button to continue.
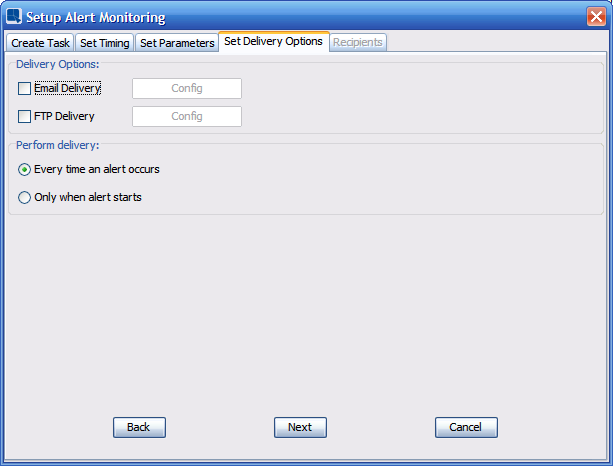
- Set delivery options -
This dialog allows you to configure the delivery options for the alert notifications.

Delivery options dialog
You have two delivery options:
- Email Delivery -
allows you to send an email when some alert was triggered during task runtime. How to configure email settings will be described later (Section 10.4.3.1.1 - Email Delivery Options).
- FTP Delivery -
uploads exported report(s) to a FTP server if a monitored alert was triggered. FTP delivery settings will be described later (Section 10.4.3.1.2 - FTP Delivery Settings).
You can select if you want to perform the delivery (send emails or upload files to FTP) every time an alert occurs or if you only want to perform it when alert starts (i.e. if alert wasn’t triggered during last check, but it is triggered during current test).
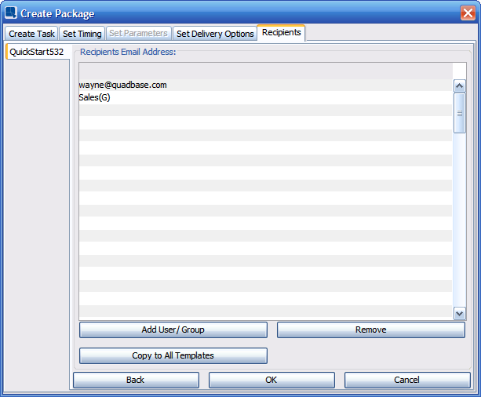
- Email Recipients -
If you selected the email delivery, the next tab allows you to specify the recipient list. The recipient list is set up differently depending on the type of monitored object you are monitoring. If the monitored object contains parameters, you will see the following dialog. This allows you to send different parameter sets to different users or groups.
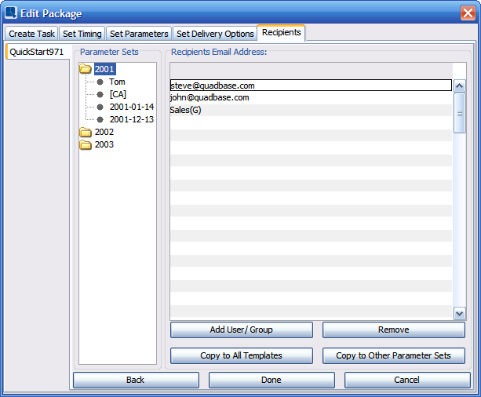
Set recipients dialog for parameterized reports
Entering recipients into the list is simple, click on the icon to select users and groups from the EDAB database. You can also add regular email addresses by double clicking any row in the recipients list and typing it in manually. You may also click on and view the Prev. List tab for previously listed recipients.
If you want to send all parameter sets or all templates to the same recipients, you don't have to add the recipients manually into all parameter sets and templates. Just add the recipients into one recipients list and then use one of the following buttons:
- Copy to all templates -
click this button to copy current recipient list into all scheduled templates recipient lists.
- Copy to other parameter sets -
allows you to copy current recipient list to the rest of the parameter sets.
For all other cases, you will see the following dialog containing only one recipients list.
Set recipients dialog


When you click the button for email delivery the following dialog will open allowing you to set an email message.

Email settings dialog
The first tab contains information for the email sent when the report or chart has successfully exported. The General Email Information portion of this tab allows you to specify the from addresses for the email as well as the subject.
The first tab is called Successful email and it allows you to set an email message which will be sent in case the scheduled task finished with no problems.
There are following elements
- From: -
enter an email address into this field. This address will be used as an email sender's address. Please make sure that your SMTP server won't reject the address (depends on your SMTP server security settings).
- Subject: -
email subject. Enter any convenient text in here.
- Email body text -
enter a message that will be sent on every task run. You can enter any text and also, you can use Runtime variables (will be described later).
- Attach exported files -
allows you to attach all exported reports and charts to the email.
- as HTML -
if this option is enabled, email body text will be replaced by the scheduled report or chart in HTML format. This option is available only if the Attach exported files is enabled and there is only one scheduled report/chart in the scheduled task. Also, PDF, SVG and Flash charts can't be added into HTML emails and only HTML and DHTML reports can be added into HTML emails. You can set the export format on the Create task tab - described in Section 10.4.3.1 - Create/Edit monitoring dialog.
- Insert runtime variables -
allows you to insert certain variables into the email body text. Variables are replaced by real values at the task run time. All variables also have a “default value”. If no convenient data can be inserted into the variable, the default value is used (for example: when user hasn't provided his name). You can choose among following variables:
- <USERNAME> -
recipient's user name. For example: you can use this variable in a salutation like
Hello <USERNAME>. This variable works only for email recipients that were chosen from the EDAB database (adding email recipients was described in previous chapter). If you add an email address to recipients list manually, no username is displayed because no username was provided.- <FULLNAME> -
recipient's full name. Just like the
USERNAMEvariable, this variable also doesn't work for manually entered recipients email addresses.- <EMAIL> -
recipient's email address.
- <TIMESTAMP> -
current time and date. Shows when the email was sent.
- <PARAMETERS> -
list of all parameter sets and parameter values.
- <SAVED_LINKS> -
links of all files in which at least one alert was triggered. Users can access the exported files through these links.
- <LIVE_LINKS> -
links of all files in which an alert was triggered. Unlike the
SAVED LINKS, these links lead to DHTML Viewer which allows users to access current version of the triggered files.- <ALERTS> -
names of all alert that have been triggered during the export.
- <ALERT_DETAILS> -
For reports, alert details are replaced by whole row of data in a format like
(COLUMN1_NAME) VALUE1 (COLUMN2_NAME) VALUE2 ...For charts, it shows values of the tooltips that would be displayed on the data points that triggered alerts. For maps, it shows all values from the data source rows associated to the areas that triggered alert.
![[Note]](../../../images/note.png) | Note |
|---|---|
In order to send email correctly the SMTP host needs to be set up. How to configure a SMTP server is described in Section 1.4.1.2 - Setting Info. |
The Failed Email tab allows you to send a different email (subject and body) to your recipients if an error has occurred during the task running (for example: one of the scheduled reports has been removed).
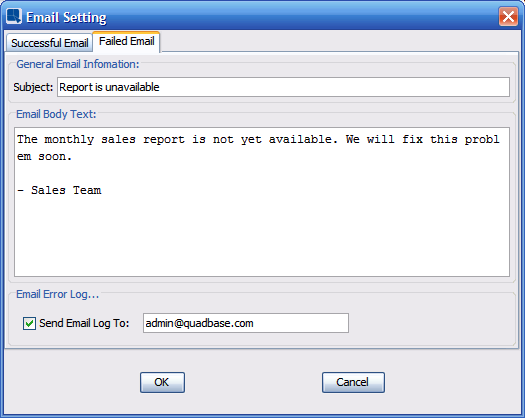
Failed email settings dialog
This tab also allows you to send the error logs to a specific user. Typically, this would be the admin or technical user who is able to diagnose and troubleshoot the problem.
When you click the button for FTP delivery the following dialog will open allowing you to set options for FTP schedule delivery.
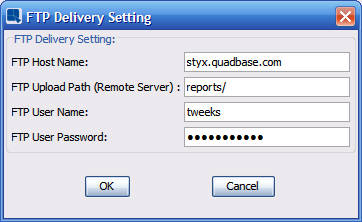
FTP Delivery Options Dialog
The following information is required for FTP schedule delivery:
- FTP Host Name:
This is the host name of the FTP server to which you would like to upload the reports. If you have a Secure FTP Server (SSH FTP), enter
sftp://- FTP Upload Path:
This is the path or directory (relative to the FTP root) where you would like to write the exported report files.
- FTP User Name:
This is the user name for the FTP server.
- FTP Password:
This is the password for the FTP server.
You can view monitoring list from pull-down menu → . The dialog allows users to view, edit and remove current monitoring tasks.
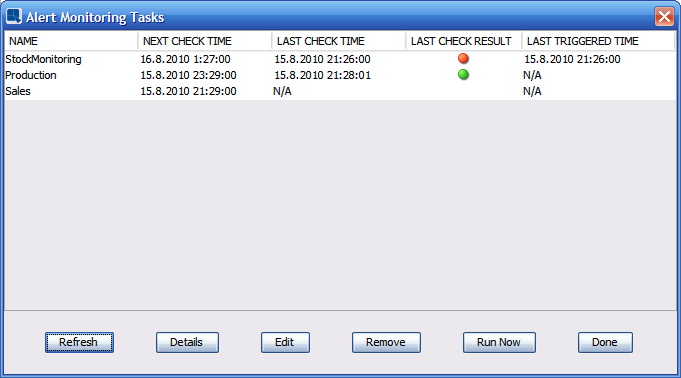
View alert monitoring tasks dialog
It also displays the following info about each monitoring task.
name
next check time
last check time
last check result (alert was triggered or not) – red light means that an alert was triggered, green light means not alerts
last triggered time
The button is similar to the button in the Schedule list dialog. It checks selected alerts immediately (and send notifications if necessary).
You can use the button to view more details about selected monitoring.
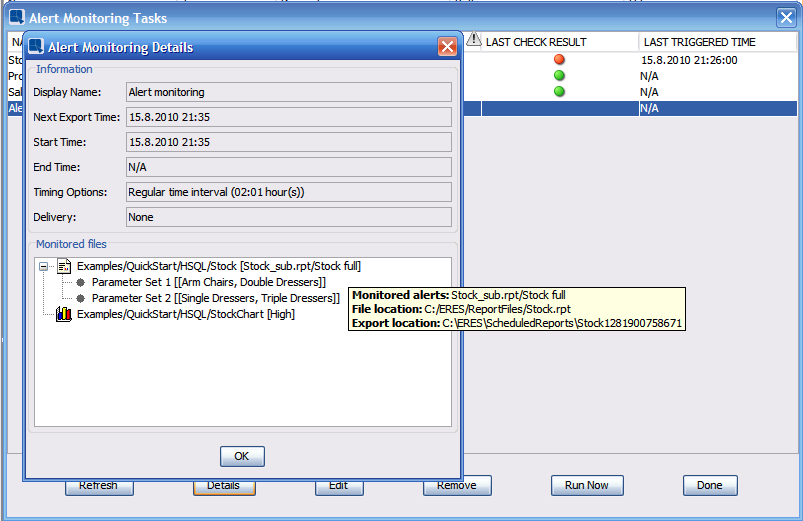
Alert monitoring details dialog
The Monitored files list contains list of all monitored files with all monitored alerts (in the square brackets). It also contains all parameter sets if the template is parameterized. If you hold cursor over a template or parameter set in the Monitored files list, you will get a tooltip with more details.
To open the monitoring log, log in as the admin, click Admin Console. Then go to the Server option tab, select the EDAB logs category and click on the button.
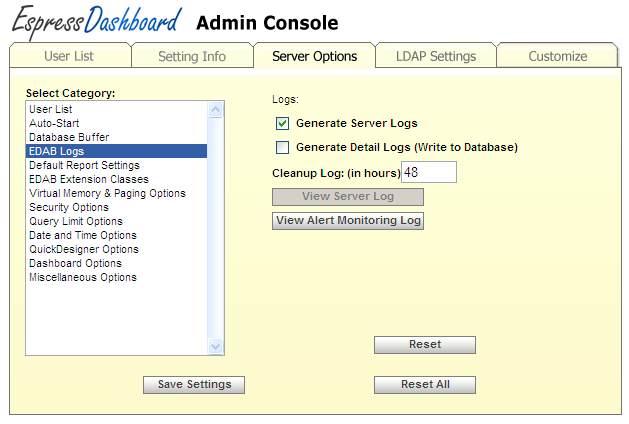
View alert monitoring log button
The monitoring log will pop up in a new window. The log contains monitoring tasks that have been checked at least once in the past.
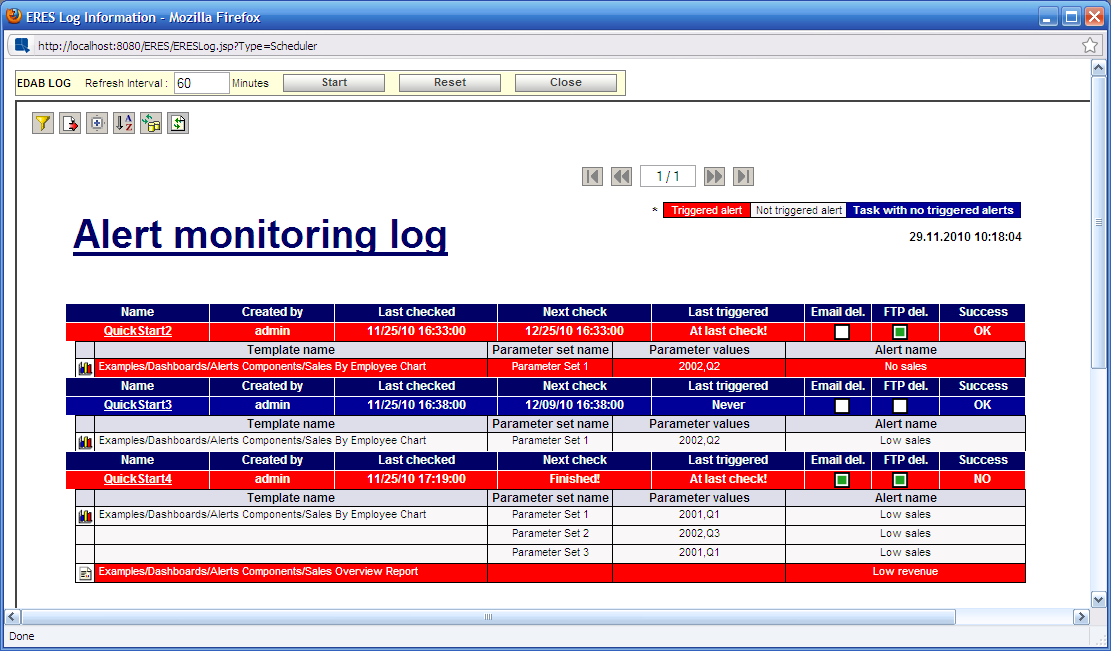
Alert monitoring log
The most important indicator is whether an alert was triggered at the last check. Basically, triggered alerts are highlighted by red color.
There are several possibilities:
Task that doesn't contain any triggered alerts looks like this:
Task with no triggered alerts
Task that contains at least one triggered alert looks like this:
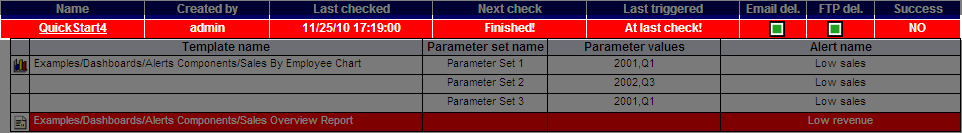
Task with one triggered alert
Alert that wasn't triggered at the last check:
Untriggered alert
Alert that was triggered at the last check:
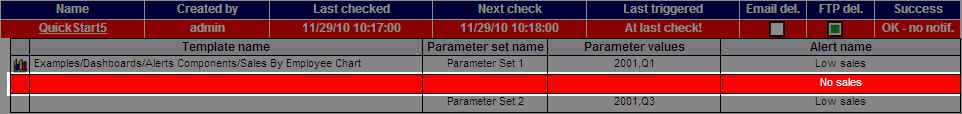
Triggered alert
Each task has a Success indicator which is not to be confused with triggered/not triggered alerts. The indicator tells whether the last check was performed successfully. There are few things to go wrong during checks - monitored templates or alerts could be renamed or removed, one of delivery options (FTP or Email delivery) could fail because of a network problem... If a check has failed, the Success indicator will look like this:  . You can get more details about failed checks in a drilldown, which will be described later.
A template can have multiple parameter sets and/or multiple monitored alerts. In such situations, the template will take several rows in the template list, but its name will be displayed only once (see the following picture).
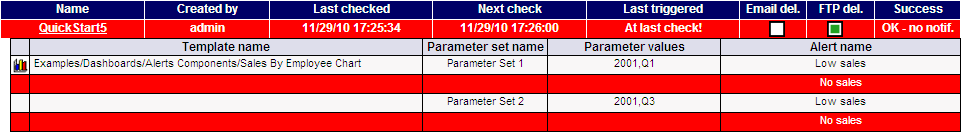
Parameterized chart with two monitored alerts
It is possible to exclude tasks without any triggered alerts from the log. To do that, click on the ![]() Filter icon and set the Show only tasks with triggered alerts? parameter to true.
Filter icon and set the Show only tasks with triggered alerts? parameter to true.
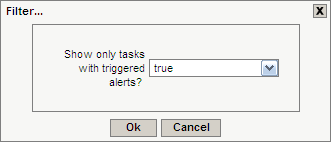
Log filter
To display detailed report about a task, click on its name. Second level of the monitoring log will open.
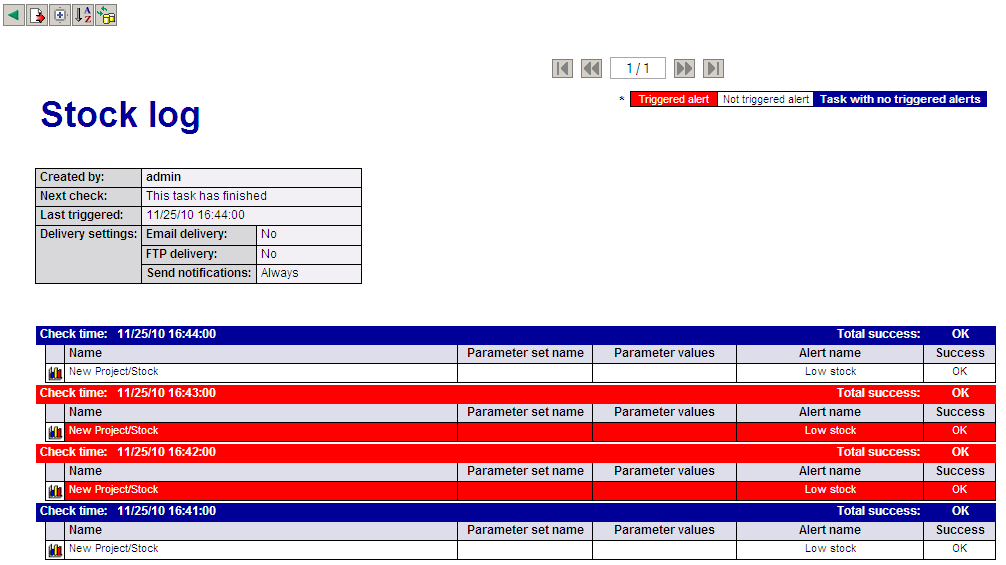
Task details
The second level log contains results of all alert checks (unlike the root level log which only contains result of last check). Triggered alerts are also highlighted by red color. The Success indicator is displayed for all templates.
If you are wondering why notifications were not send, always check the Send notifications indicator. The indicator has two possible states:
- Always -
notifications should be sent every time an alert occurs
- First alert occurrence -
notifications will be sent only when an alert wasn't triggered during the previous check, but was triggered at the current check. So if an alert was triggered in two consecutive checks, notifications would be sent only once. If notifications were not sent because of this feature, the task's Success indicator will look like this
 .
.
To go back to the root level log, click on the ![]() icon.
icon.
If the task uses some additional delivery method(s) (FTP or Email), you can click on the Success indicator. A third level of the monitoring log will open showing the delivery method's settings and results. If there is no additional delivery method, the Success field will not be clickable.
The third log level's appearance may vary. If a notification was performed, its detailed log will open. If a notification wasn't performed (for example: the alert wasn't triggered), only delivery settings will be shown.
| Note |
|---|---|
There is a difference between not performed delivery and failed delivery. A delivery isn't performed when the alert wasn't triggered or, in some cases, when the Send notifications on first alert occurrence only feature is enabled (as described above). In that case, the EDAB server doesn't even try to perform the delivery. If a delivery failed, it means that the EDAB server tried to perform the delivery (because the alert was triggered), but it wasn't able to finish (for example: because of a network problem, a human error...). |
Delivery settings
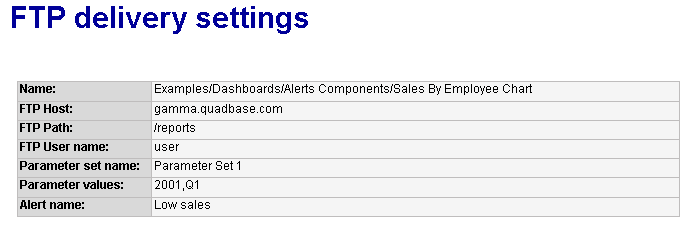
FTP delivery settings
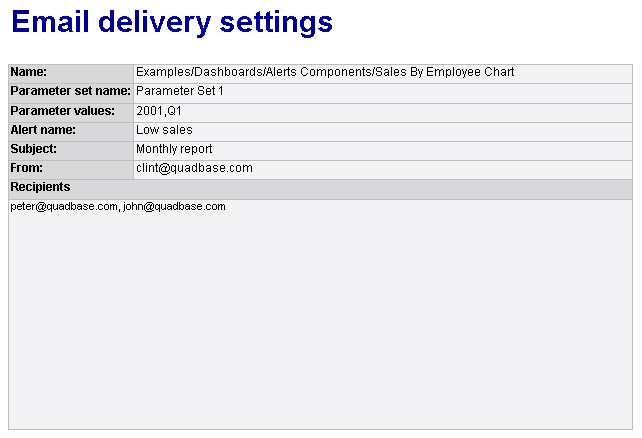
Email delivery settings
Delivery logs
FTP delivery log shows FTP delivery settings + results. If the delivery has failed, an error message is also displayed.
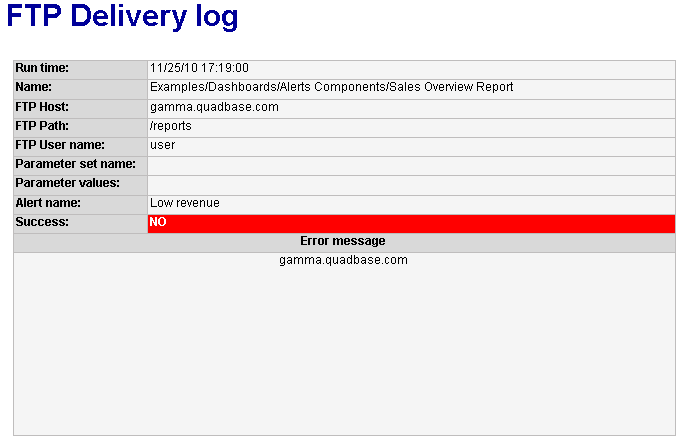
FTP delivery log
Email delivery log shows basic email settings and results for all recipients. In the following picture, you can see that emails from clint@quadbase.com to john@quadbase.com and peter@quadbase.com (not actual email addresses) couldn't be sent because the EDAB server wasn't able to connect to the SMTP server at localhost:25. It could be caused by a network problem or by incorrect SMTP settings (as described in Section 1.4.1.2 - Setting Info). This is probably the most common problem with email delivery.
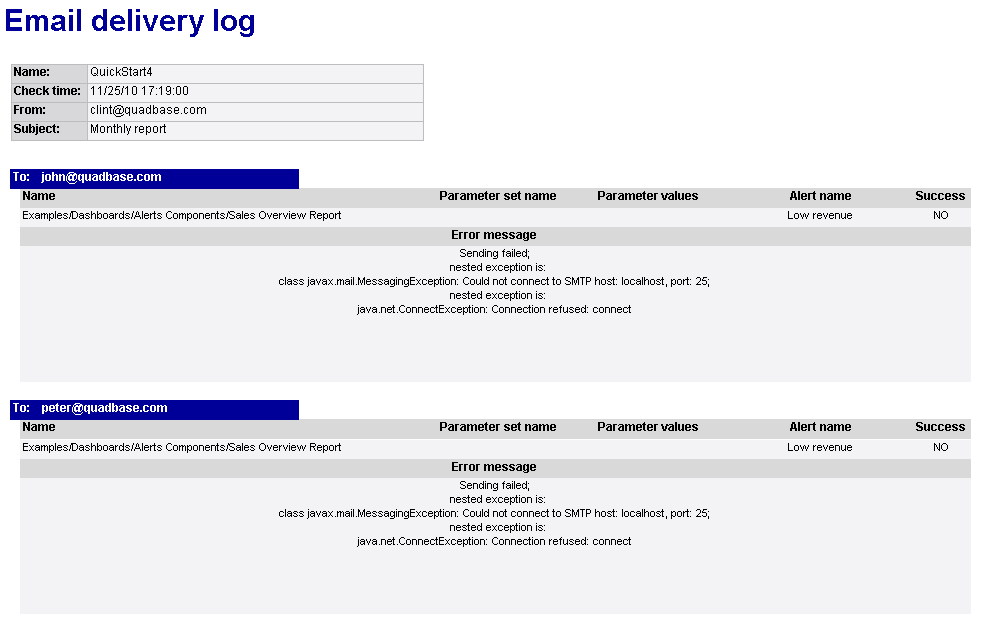
Email delivery log