Unlike Google Maps, SVG Maps do not use map points. They use map areas. The map areas can be colored according to some values from the map data source. Coordinates of the map areas are defined in SVG map image. Virtually any SVG image can be used for SVG Maps, but it usually requires some modifications, which can be done in any graphical editor with SVG support. EDAB does not contain any integrated graphical editor, so you have to use third party software. The recommended software is Inkscape, which can be downloaded at www.inkscape.org. Inkscape is released under GPL license version 2, so it is free for commercial and non-commercial use.
SVG (Scalable Vector Format) images consist of objects. Any of these objects can be used as map area. To distinguish among individual map areas, EDAB uses Area ID. Each map area has to have an Area ID. Unlike Point ID, Area ID does not have fields (it always consists of only one field). The Area ID has to be unique for every area. The Area IDs are read from the SVG Image object ID attribute. This attribute can be set in most of the graphical editors. See the next chapter for the step-by-step instructions for the recommended tool - Inkscape.
EDAB is distributed with several SVG images that are already prepared to be used for creating SVG Maps without any modification. These images can be found in the <EDAB_Installation_directory>/MapFiles/SVG. They are also inserted in the Organizer in the SVGMaps project. You can find the list of all these maps in the Appendix 4.A - List of SVG Map Images.
Download the Inkscape editor (http://www.inkscape.org/) and install it on your computer. Open an SVG image. Complex SVG Images may consist of groups, with each group consisting of several elements (areas). Right click on the area that you want to change ID of. At the bottom of the pop-up menu, notice the option called Enter group [name of the group] (see the screenshot below) and click on it to enter the group.
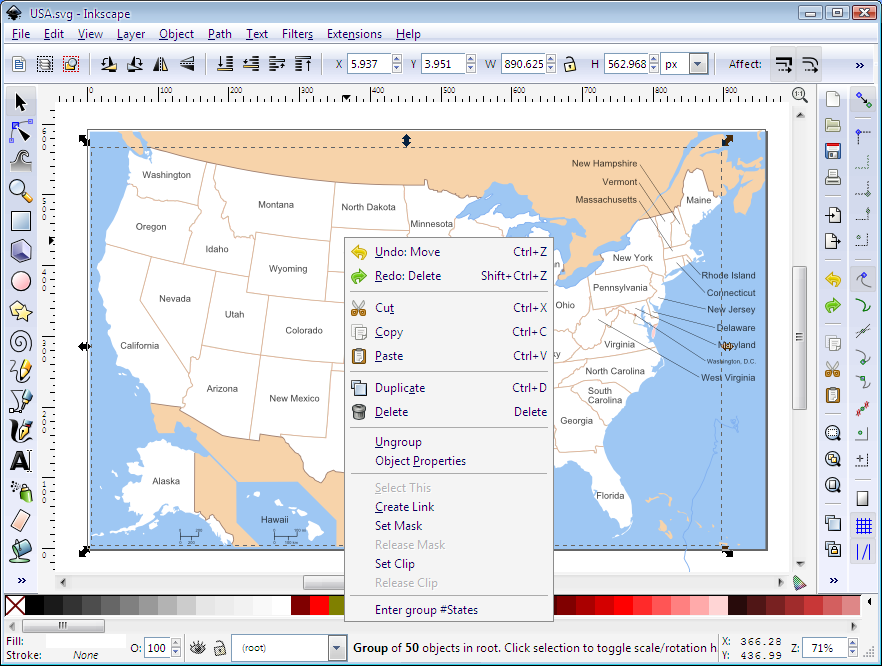
Inkscape - Entering Object Group
Right click on the area you wish to change ID of again and select the Object properties option. Fill in the new Area ID in the ID field and confirm it by pressing the button. Close the Object properties dialog. Now you can set Area IDs for other objects in a similar way.
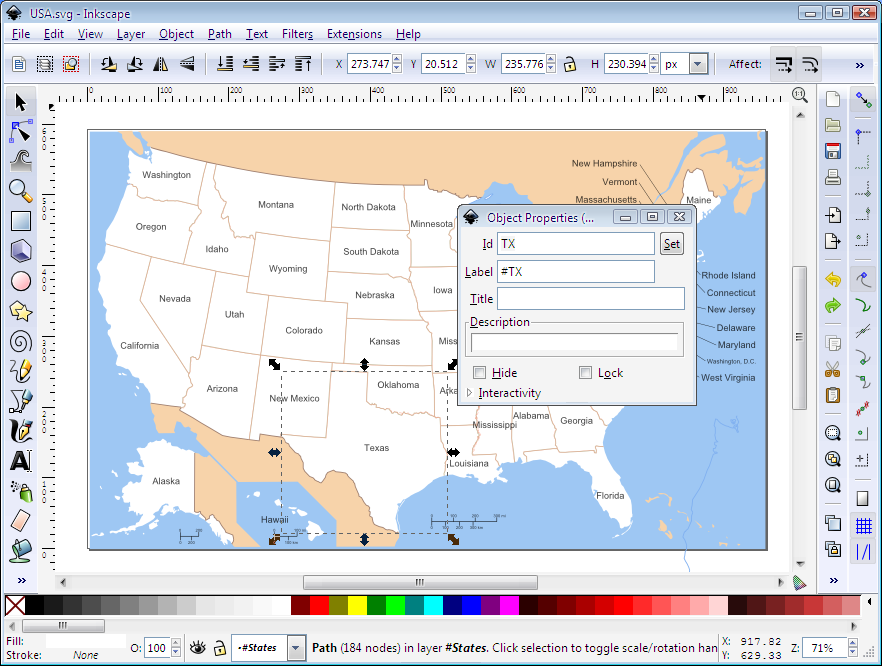
Inkscape - Editing ID Attribute
If your map area consists of several unconnected SVG objects (like Alaska and Hawaii for USA), you can group them in one group and assign the Area ID to whole the group. To do that, do not enter the group as described above, but go to the Properties dialog for whole the group and assignee the ID there. If a group has Area ID assigned and there are objects inside this group that also have Area IDs assigned, there can be conflicts, if both the Area IDs (ID of whole the group and ID of an object from this group) occur in the map data source. In this case, the behavior is undefined, so you can get unexpected results. It is OK to have groups with Area IDs that contains objects with Area IDs, unless you use both IDs simultaneously in your data source. It can make sense in some applications (e.g. you can have a world map with continent names as well as country names. You can safely use this map, if you use either continent names or country names separately).
To save the changes, open menu (upper left corner) and select . Note that SVG images that you want to use for creating SVG Maps have to be inserted in Organizer.
SVG Map needs an SVG image that defines the map areas. All the SVG objects from the SVG image can be used as map areas. The only requirement for these SVG object is that they have to have an Area ID assigned as described in the previous chapter. These Area IDs are used for mapping the map data source rows to map areas (SVG objects). Unlike the Point IDs, Area IDs cannot have multiple fields, so the mapping is much simpler. It is enough to select just one data source column, which will be mapped to the Area ID. A map area is associated with the data source row, which has the value of the mapped column equal to the Area ID (comparison is case sensitive).
In the SVG Maps, the map data source is used for coloring areas according to numerical value of some data source column. It brings one more limitation for the map data source comparing to Google Maps. There should be at most one matching data source row for one Area IDs. If there is no matching row, the area will have the original (unchanged) color. If there is exactly one, the fill color of the matching map area will be changed according to Thresholds (see Section 4.4.4 - Setting Thresholds). If there is more than one matching row, the behavior is undefined. There will be no error message, but the data displayed may not have sense.
Create a new map, select SVG Map and click . Select an SVG image that should be used as the map image from Organizer and click . Select a data source column that should be mapped to the Area IDs.
There are the following buttons on the SVG Map Builder toolbar:
| New: Creates new Map/Coordinates |
| Open: Opens existing Map/Coordinates |
| Save: Saves current Map to file and Organizer. Note that all saved files will include the userID and the timestamp in addition to the name you have provided. If an organizer item with the supplised name exists in the folder, you will given a choice to override the existing item or create a new entry. |
| Map Options: Changes dimensions of the map. |
| Map Title Options: Allows you to set map title and its options. |
| Set Thresholds: Configures threshold values, colors, and the legend. |
| Tooltip options: Choose which data source fields will be displayed in tooltips. |
| DrillDown Options: Enables and configures drill-downs. |
| Change Area ID mapping: Changes the Area ID mapping. |
| Change Data Source: Changes the data source of current map. Note that changing data source may result in loosing your Threshold settings if the new data source is not compatible with the old one. |
| Refresh / Set Parameters: Refreshes the map data (if the data source changed). This button also allows you to set different parameters for parameterized maps. |
Thresholds allow you to differentiate areas by color based on value in a particular data source column. If a threshold is set, all the map areas (i.e. objects for those there is record in the map data source) are colored with color assigned to the appropriate value range.
To set Thresholds, click on the button. Select the threshold column (i.e. column that will be compared to the ranges defined below). Only numerical column can be selected. You can add some threshold value(s) in actual values, or percentage unit. To add threshold value, click on the ![]() button next to the empty table field. A dialog box will open prompting you for the new threshold value. You can either enter it manually or select one of the suggested values from the drop-down list at the bottom of the dialog. This list contains all the values from the selected threshold column rounded to two non-zero digits. (There is a third way to enter threshold values for percentage units. It is an option to enter a number of intervals.) After adding the first threshold value, two ranges are added - for the values below and above the given threshold value. Any threshold value added after will create only one new range by splitting one of the old ranges in two. You can edit any of existing thresholds by clicking on the appropriate range (the first column in the table).
button next to the empty table field. A dialog box will open prompting you for the new threshold value. You can either enter it manually or select one of the suggested values from the drop-down list at the bottom of the dialog. This list contains all the values from the selected threshold column rounded to two non-zero digits. (There is a third way to enter threshold values for percentage units. It is an option to enter a number of intervals.) After adding the first threshold value, two ranges are added - for the values below and above the given threshold value. Any threshold value added after will create only one new range by splitting one of the old ranges in two. You can edit any of existing thresholds by clicking on the appropriate range (the first column in the table).
To change the color assigned to a value range, click on the empty table field next the value range you want to change the color of. You can then select one of the predefined colors, or choose any color by entering its red, green and blue component values (each value is an integer within the 0-255 range). To remove a threshold value, click on the red ![]() button next to the value you want to remove. Changes will take effect after you confirm the Set Thresholds dialog by clicking .
button next to the value you want to remove. Changes will take effect after you confirm the Set Thresholds dialog by clicking .
To remove all the Thresholds and disable coloring of areas, delete all the threshold values or select the empty field for the threshold column.

Set Thresholds dialog
The Thresholds dialog also allows you to add a legend to describe the value ranges. To enable the legend, check the Enable Legend checkbox. Then you can select position and layout of the legend. If the legend is enabled, there will appear legend input fields next to the value ranges. Insert the description of the ranges in these fields. If the legend is too large to fit to one column (for vertical layout) or row (for horizontal layout), it is split into more columns/rows. If it still does not fit the map canvas even after splitting, it will not be displayed. In this case you can try to resize the map or change the position or layout of the legend.

Setting Legend
Click on icon. Select a parameterized report, chart, or map (only files inserted in Organizer will be visible). All parameters will be automatically mapped to the Area ID. It means that all the parameter of the DrillDown report, chart or map will be set to the Area ID of the selected area. It is not possible to change the mapping. SVG map also does not support multi-value drill-downs (multi-value parameters are treated as single-value).
Titles for SVG Maps can be inserted in the same way as for the Google Maps. The options are also the same. See Section 4.3.6.3 - Google Maps Titles for more details.
Tool-tips in SVG maps are different than tooltips in Google maps. In SVG maps, there are no reports in tool-tips, just data from data source fields associated with particular map area.
To set up tool-tips in a SVG map, click on the ![]() icon on the main toolbar. The following dialog will appear:
icon on the main toolbar. The following dialog will appear:
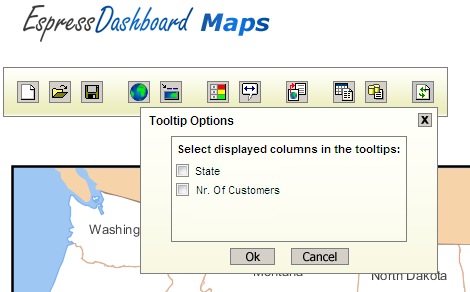
Tool-tip options dialog
On this dialog, you can choose which data source fields will be displayed in tooltips, which will pop up when mouse cursor moves over a map area.
![[Note]](../../../images/note.png) | Note |
|---|---|
If you deselect all options on the Tooltip options dialog, default browser tool-tips will be displayed, showing SVG area IDs. |

SVG Map with a Tool-Tip