Once you have created a chart in QuickDesigner, you can share it with other users, by saving it on the server, and inserting it into the Organizer. You can also export the chart in a number of formats onto the client to save locally or print.
![[Note]](../../../images/note.png) | Note |
|---|---|
The saving and exporting options are only for stand-alone charts. Charts embedded in reports cannot be saved or exported on their own using QuickDesigner. |
To save a QuickDesigner chart, click the ![]() button in the toolbar. A dialog will open in a new window.
button in the toolbar. A dialog will open in a new window.
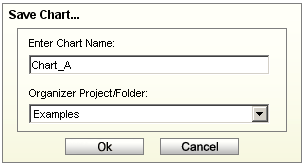
Save Chart Dialog
The first option allows you to specify a name for the chart. The chart will be saved with a .qch extension. The QuickDesigner chart format (.qch) is exactly the same as the chart template (.tpl) format. However, only files with a .qch extension can be re-opened with the QuickDesigner interface. If you make changes to a QuickDesigner chart using the Chart Designer interface, a new template with a .tpl extension will be created.
The drop-down list at the bottom contains all the Organizer projects and folders you have access to. Select the project or folder you would like to place the chart to.
Once you have finished specifying options, click the button to save the chart. The new file will be saved in the ChartFiles folder in the EDAB installation directory as ChartNameInOrganizer_Username_TimeStamp.qch. This should help to avoid unintentional overwriting of chart files.
Even though it is allowed to have multiple items with the same name in the same Organizer folder, when saving a new chart to an Organizer folder where the selected name already exists, you will be asked to confirm overwriting of the existing entry or creating new one. If you wish to save the changes in the existing chart that you have opened, do not change the chart name and the Organizer folder in the Save Chart dialog and the chart file will be updated.
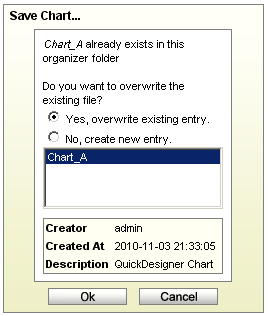
Chart Overwrite Dialog
You can also export the chart back out to the client in a variety of image formats. To export the chart, click the ![]() button on the toolbar. A dialog will open in a new window prompting you to specify export options.
button on the toolbar. A dialog will open in a new window prompting you to specify export options.
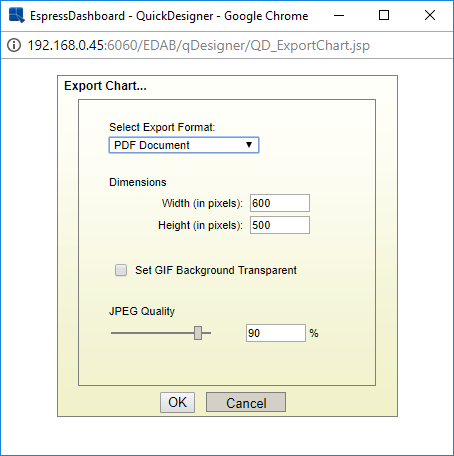
Export Chart Dialog
The first option allows you to specify the format in which to export the chart. The available formats are GIF, JPEG, PNG, BMP, PDF, SVG, Flash, XLS (MS Excel), Text, XML, and MAP (chart image map).
The second option allows you to set the dimensions of the exported image. By default, these will match the canvas dimensions of your chart.
The last set of options allow you to set some image type-specific options. You can set the background transparent for GIF files, set the quality for JPEG files, as well as specify encoding for PNG files.
For more information about chart export options, please see Section 3.6.2 - Exporting Charts.
Once you have finished specifying options for the exported chart click . A new window will open containing the exported chart. The toolbar is active on this window allowing you to save the generated file to the local system, or to print the chart locally.
Exported Chart