The Chart Designer is a graphical user interface, launched within the Organizer that allows users to create and customize reports. The simple drop and drag style interface and extensive editing/formatting capabilities, makes report design quick and easy.
It is important to note that in ERES there are two ways that you can use charts. Charts can either be placed within reports or designed and run as stand-alone entities. A unique feature of charts placed in reports is that they can use the report data as their data source. In this instance, the chart cannot be deployed outside of the report.
Charts that use their own data sources can be deployed independently from reports, either in menu pages or using image URLs to embed them in web pages.
The Chart Designer interface is always loaded from within the Organizer. To start a new chart, you can click the button on the toolbar or select → . You can also start Chart Designer when creating or editing data sources in the registry. The button allows you to preview a data source and to build a chart or report. In addition, you can open the Chart Designer to edit a chart template file in the Organizer. To do so, first, select the file that you would like to open and then you can select → or right click on the file and select Open File from the pop-up menu.
If you are creating or adding an embedded chart within a report, the Chart Designer is launched from within Report Designer by either clicking on the button on the toolbar or by selecting → .
The first step in designing a chart is to select the data source from which the chart is to be drawn. The first time you select to start a new chart you will be prompted to select the data registry that you would like to use. If there are not currently any available registries (meaning that you have not created any or you do not have privileges to view any), you will be prompted to go the Data Registry Manager to create one. For more on data sources, please see Section 2.4 - Working with Data Sources
Once you have selected a registry, a Data Source Manager window will open allowing you to select, add, or modify a data source that you would like to use for the chart or report. Note that the registry will not open if you are building a chart from the registry in the Modify Data Sources dialogs.
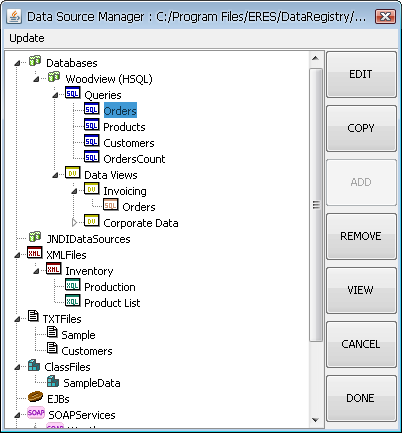
Data Source Manager Window for Chart Designer
If you are launching Chart Designer from within Report Designer (using the Insert Chart option), the following dialog will be presented:
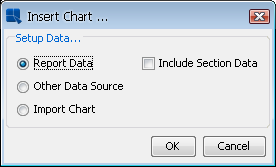
Chart Data Options
The following options are available:
- Report Data:
This will plot the chart using the data contained in the report. This data includes all of the report columns and computed columns that have been added using the Report functions. When using report data for the chart, you also have the option to include section data. This will take any formulas or labels from the report section in which the chart is placed and make them available to the chart. Data for labels and formulas is imported as additional columns to the chart input data. The cell ID is used as the column name.
However, when you use report data, the chart cannot be deployed independently from the report, and certain charting features like time-based zooming and histograms are not available.
- Other Data Source:
This will allow you to select a different data source than the report data. If you select this option, you will go to the Data Source Manager window where you can create or select a data source for the chart.
When you use an independent data source the chart can later be deployed independently from the report. Also, all of the charting features are available. Note that some features like drill-down are only functional when the chart is deployed independently from the report.
- Import Chart:
Choose this option to import an existing chart to the report.
If you are launching Chart Designer from within Report Designer (embedded chart) and you elect to use an independent data source that is a parameterized query or class file, by default it will run with default values when the chart is run in the report. However, you can use the chart parameter linking feature for the chart to retrieve its parameter values based on column values in the report. This feature works in the same manner as the sub-report linking feature described in section 9.4. To link a parameterized chart to a column, first, insert a parameterized chart into a report. Then, select Chart Parameter Mapping from the Data menu in Report Designer. This will bring up a dialog allowing you to map column fields from the report to query parameters in the chart.
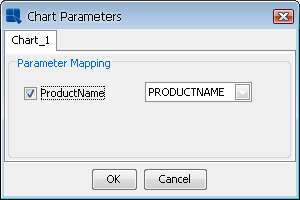
Chart Parameter Mapping Dialog
The dialog contains a tab for each parameterized chart. Each parameter in the chart can be mapped to a different column field in the report.