EspressReport ES can draw data from JDBC/ODBC compliant databases, text files, XML files, EJBs, and even bring in object/array data through class files. Prior to creating reports or charts, users must first set up the data sources that they would like to use. Data source information, including database connection information, database queries, text file location, XML file/DTD/Schema location, Java class location, and EJB connection information is stored in XML registry files that are set up and defined within the Organizer interface.
To edit or create a data registry, you can either select the Manage Data Sources option from the File menu, or click on the icon on the toolbar. This will launch the Data Registry Manager dialog.
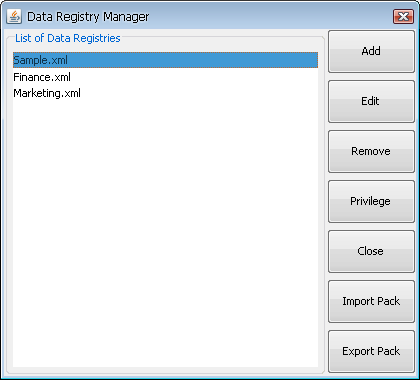
Data Registry Manager Dialog
From this dialog you can add, remove, and edit registries, as well as assign user privileges for data registries.
To add a registry, click the button and a dialog will appear prompting you to specify a filename for the new registry. Click and a new Data Source Manager window will open allowing you to set up data sources within the registry.
To edit a registry, first select the registry that you would like to modify from the list in the left-hand side of the window, and click the button. This will bring up a Data Source Manager window for the selected registry file.
A data registry consists of several files (such as database queries, text files, xml files etc.). If you export a data registry, all of these files will be packed in a single rpak file that can be archived or imported in another ERES installation/server.
To export a data registry, select the registry and click on the button. Enter a file name and click .
![[Note]](../../../images/note.png) | Note |
|---|---|
Only administrators can export or import data registries. |
To import a data registry, click on the button. Select a rpak file. You can insert the data registry with it's original name, or you can change the name in the New registry name field. If you want to choose which files should be unpacked or change their path or file name, click on the button.
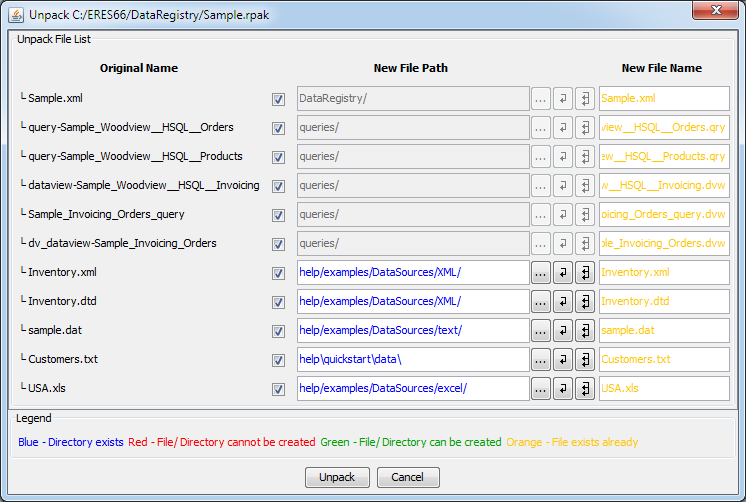
Unpack dialog
On this dialog, you can choose files to be unpacked and you can also change their names and paths.
If you don't want to unpack a file at all, uncheck it's 'unpack file to disk' check box.
| Note |
|---|---|
File path of certain kinds of files (for example: sql queries) can't be changed. In such cases, the New file path field and buttons will be disabled. |
Click to get back to the Import Data Registry dialog.
Click . Now, the data registry will unpack all of it's contained files. It is possible that some files from the rpak file have the same file names and paths as some existing files on your hard drive. If there are any filename conflicts, the following dialog will pop up.
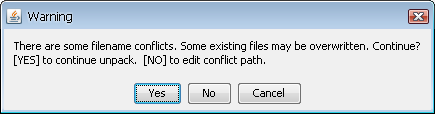
Data Registry Manager Dialog
If you click , conflicting files on your hard drive will be overwritten by files from the rpak file.
If you click , no action will be taken and no data registry will be imported.
If you click , the Unpack dialog will open again allowing you to solve the filename conflict.
As with other objects in EspressReport ES, the administrator can also assign privileges to Data Registries. These include access permissions (read/write) as well as content filtering (limiting which sources in the registry that users or groups can see).
To set privileges for a registry, select it in the Data Registry Manager, and click the button. This will bring up a dialog listing permissions for the file.
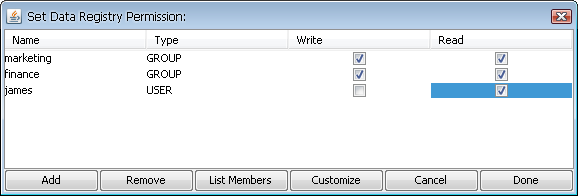
Registry Privileges Dialog
To give users or groups access to the registry, click the button. This will bring up a list of all the defined users and groups. Select the groups and users you would like to add from this dialog. For each user or group, you can set their access to read-only, or read-write.
For each user or group that has access to the data registry, you can also customize their view of the registry. This allows you to limit the access of a group of users to specific data sources, or types of data sources. To customize the registry display, select one of the users or groups in the registry privileges dialog, and click the button. This will bring up a dialog showing all the data sources that have been defined in the registry.
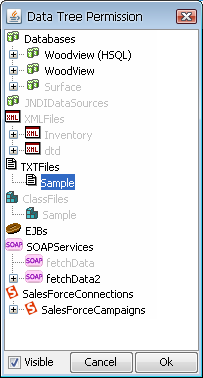
Customize Registry Dialog
Each node (data source) in the registry can be set to visible or invisible, by selecting it, and checking the option at the bottom of the dialog. Invisible nodes will appear in gray. Note that if you render a parent node invisible, all the sub-nodes will be invisible, so you can't make the Queries node invisible, but have individual queries visible.
Once you have finished click the button and the settings will be associated with the user or group. When they access the registry, only the visible nodes will appear.
When you edit, or create a new data registry, the Data Source Manager window will open allowing you to add and edit data sources. The Data Source Manager is a visual representation of the registry XML file.
| Note |
|---|---|
The XML data source repository only stores location and connection information, and not the actual data. It is not an XML file that contains data to be used in a report or chart. |
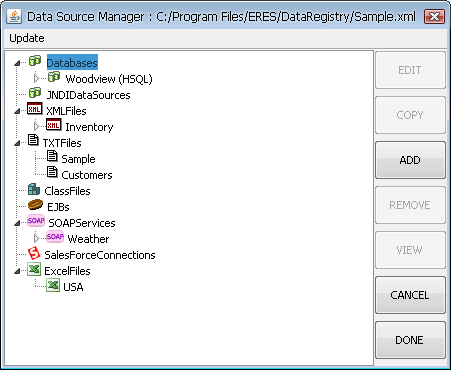
Data Source Manager Window
The left-hand side of the window contains a tree listing all of the data sources in the registry file. Grouped under Databases are the individual databases and their associated queries and data views. Grouped under JNDIDataSources are database sources that use JNDI (Java Naming and Directory Interface) name to connect instead of JDBC. Grouped under XMLFiles are all the XML files and their associated queries, grouped under TXTFiles are all of the specified Text files, grouped under ClassFiles are all of the specified class files, and grouped under EJBs are all the specified EJB connections.
The right-hand side of the window contains a series of buttons controlling all of the functions of the Data Source manager. Each button performs the following functions.
- Edit:
This allows you to modify attributes of a data source. For a database it allows you to change the connection information, and modify queries/data views. For XML files it allows you to change the file and dtd location, and modify XML queries. For text files it allows you to change the display name, and file location. For class files, it allows you to change the display name and modify the location. And for EJBs it allows you to change the display name, as well as the parameter values.
- Copy:
This option is only available for queries, and data views. It allows you to make a copy of the specified query or data view.
- Add:
This option allows you to add a data source. It will create a new source depending on which node is selected in the left-hand side. Hence, if you select the TXTFiles , and click , you will be prompted to add a new text file data source.
- Remove:
This option will remove the selected data source.
- View:
This will open a new window showing the tabular data from the selected data source, either query, XML file, text file, class file or EJB. For data views the data view query interface will start. From this window you can elect to create a new report or new chart by selecting the appropriate button. In addition, you can transpose the data source before creating a report(see Section 2.4.2.1.1 - Transposing Data to learn more about Transpose Data).
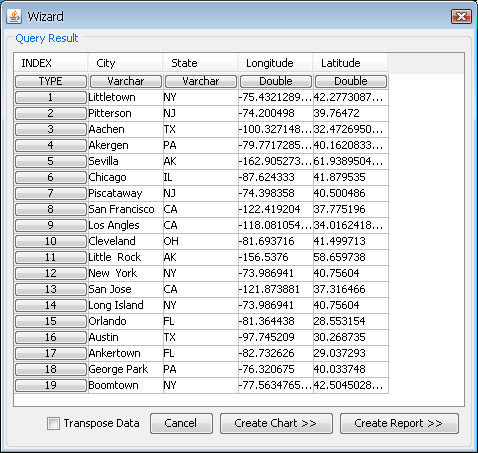
View Data Source Dialog
- Cancel:
This will cancel the wizard process.
- Done:
This will save any changes you've made in the registry, and return you to the registry list.
If you preview a data source in the Data Source Manager (see Section 2.4.2.1 - Using Data Source Manager to learn more about the Data Source Manager), you can transpose the data source to create a report only. This transpose data option cannot be used to create a chart. To configure data transposition for charts, please refer to Section 3.13.1.1 - Data Transposition.
| Note |
|---|---|
This transposition method is available only in the data source preview dialog (that means that you have to open the Data Source Manager, select a data source and then click the button). |
For example, the following screen shot shows the query result from a data source.
Data Table Dialog
To transpose the data, click the checkbox at the bottom of the data table (query result) window. A new window will open prompting you to select the columns that you would like to transpose.
Select Transpose Dialog
Check the columns that you would like to transpose and click . You will return to the data table where you will see the results of the data transposition. Columns that you have selected are removed from the data table and the transposed columns are placed at the end of the table as new columns.
| Note |
|---|---|
Columns that you select must have the same data type. |
Data After Transposition
The botton is greyed out. As we previously mentioned, transpose data from Data Source Manager is only for creating report and not for chart creation.
The data registry has an automatic node locking system designed to block multiple users from editing related nodes at the same time. The system utilizes your IP address, your username, and a special token to determine whether you are allowed to add, remove, or edit a specific node. If you are currently editing a node, other users will not be able to edit the node. However, if you disconnect from the server or move to another computer and try to open the same node from the same user name, an option box will appear allowing you to override your previous lock.
Please note that the admin is capable of unlocking any node, even if they did not open it in the first place.
The data registry is a tree where the data type is the root and the queries and files are the leaves. Changing any node within a particular branch will lock all parent nodes and all child nodes in that branch. Here are some examples of how the node locking system works.
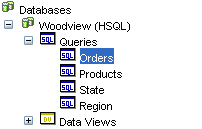
Locking Query
In the above image, you can see that the database Woodview (HSQL) and query Orders are part of the same branch. So if you edit the Orders query, it will lock both Orders and the database Woodview (HSQL). If you edit Woodview (HSQL), the database will be locked and all child nodes connected to this database will be locked as well, which includes Orders, Products, State, and Region.
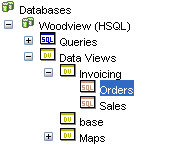
Locking Data Views
In the case of data views, there are three levels in the tree. In the above image, editing the Orders data view query will lock the query, the data view Invoicing, and the database Woodview (HSQL). If the data view Invoicing is being edited, both queries Orders and Sales will be locked as well as the database Woodview (HSQL). However, in both of these scenarios, other data views and queries can still be edited. If the database Woodview (HSQL) is being edited, all data views as well as their queries will be locked.
ERES can draw data from any JDBC/ODBC compliant database. In order to connect to a database via a 3rd party driver (other than the ODBC-JDBC bridge), you will need to add the classes for that driver to the classpath of the application server/servlet runner where you have deployed the ERES server. If you installed ERES with Tomcat, then you need to modify the setclasspath.bat/.sh file in the /bin/ directory of your Tomcat installation to add the driver classes, or copy them to the <ERESInstallDir>/WEB-INF/lib directory. Note that JDBC drivers for MS SQL Server, MySQL, Oracle, Informix and PostgreSQL databases are included as a convenience. Other database JDBC jar files were not included because of licensing, multiple drivers and/or other concerns although support for those databases exist and the jar files can be explicitly added.
The first step in using a database as the data source, is to set up the database in the registry, and specify the connection information. To add a database, click on the Databases node, and click the button. This will bring up a window prompting you to specify the connection information for that database. You can choose a database to connect to from the Driver List or specify the information directly. Fields to enter are database name, URL, and driver. You can also select whether the database requires a login, and if so whether you want to save username and password information by using the check boxes at the bottom of the window. If you select to save login and password information, you can then enter that information in the last two spaces. Click on and the new database will be added to the Data Source Manager window.
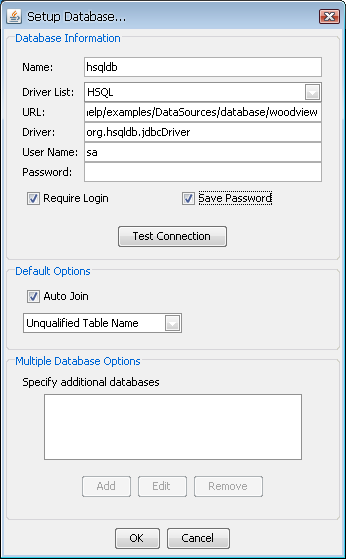
Add Database Dialog
In order for ERES to make a connection to the database, the following information must be provided.
- URL:
This JDBC URL specifies the location of the database to be used. A standard JDBC URL has three parts, which are separated by colons:
jdbc:<subprotocol>:<subname>
The three parts of a JDBC URL are broken down as follows:
jdbc- the protocol. The protocol in a JDBC URL is alwaysjdbc.<subprotocol>- the name of the driver or the name of a database connectivity mechanism, which may be supported by one or more drivers. A prominent example of a subprotocol name isodbc, which has been reserved for URLs that specify ODBC data source names. For example, to access a database through a JDBC-ODBC bridge, one might use a URL such as the following:jdbc:odbc:Northwind
In this example, the subprotocol is
odbc, and the subnameNorthwindis a local ODBC data source, i.e.Northwindis specified as a system DSN under ODBC.<subname>- a way to identify the database. The subname can vary, depending on the subprotocol, and it can have a subsubname with any internal syntax the driver writer chooses. The function of a subname is to give enough information to locate the database. In the previous example,Northwindis enough because ODBC provides the remainder of the information.
Databases on a remote machine require additional information to be connected to. For example, if a database is to be accessed over your company Intranet, the network address should be included in the JDBC URL as part of the subname and should follow the standard URL naming convention of
//hostname:port/subsubname
Assuming you use a protocol called
vpnfor connecting to a machine on your company Intranet, the JDBC URL you might use may look like:jdbc:vpn://dbserver:791/sales (similar to
jdbc:dbvendorname://machineName/SchemaName)It is important to remember that JDBC connects to a database's driver, not the database itself. Hence, the database driver writers are the ones who actually determine what the JDBC URL that identifies their particular driver will be. Most often, your database vendor also provides you with the appropriate drivers. It is highly recommended that users contact their database driver vendor for the correct JDBC URL that is needed to connect to the database driver.
- Driver:
This is the appropriate JDBC driver to be used to connect to the database. If you are using the JVM included with the installation (or Oracle's J2SE), use the following driver specification to connect to an ODBC data source.
sun.jdbc.odbc.JdbcOdbcDriver
You can also specify a JDBC driver name specific to your database if you are NOT using the JDBC-ODBC bridge. For example, the Oracle database engine will require the driver
oracle.jdbc.driver.OracleDriver.- User Name:
This is the login used for the database.
- Password:
The password for the above user.
Once you've specified the connection information, you can test the database connection by clicking the Test Connection button. This will test the connection using the information you've provided, and report any problems.
The Default Options portion of the dialog allows you to specify some properties for queries generated through the Query Builder interface or data views. You can specify whether to auto-join selected tables. Auto-join will attempt to join primary and foreign keys defined in the database. You can specify the table name format that should be used for queries either unqualified (only table name), or 2-part or 3-part qualified. Properties specified here will become the defaults for new queries and data views. They can also be modified for individual queries.
The Multiple Database Options portion of the dialog allows you to specify additional databases (i.e., additional database URL's) to obtain data from within the query. This option is only available when the database (original and any additional database) is MS SQL Server and 3-Part Qualified Table Name option is chosen. Note that the same login details as well as the same driver (as defined in the original connection) are used to connect to the specified additional databases as well. The query can obtain data by referencing a column in the additional database using a 3-Part table nomenclature.
There are two sample databases included with the ERES installation. One is an HSQL (a pure Java application database) database, and the other is an MS Access database. Both contain the same data, and are located in the help/examples/DataSources/database directory. For details about how to set up connections to these sample databases, please see Section Q.3.1.1 - Setup Database Connections of the Quick Start.
In addition to connecting to databases via JDBC, ERES lets you use the JNDI (Java Naming and Directory Interface) to connect to data sources. In ERES JNDI data sources are treated just like database data sources and support the same functionality (queries, parameters, data views, etc.). The advantage to using a JNDI data source is that it potentially makes it easier to migrate reports between environments. If data sources in both environments are setup with the same lookup name, reports can be migrated without any changes.
To connect to a JNDI data source in ERES you must have a data source deployed in the same Web application environment as you are running the ERES server. To setup a JNDI data source, select the JNDIDataSources node in the data source manager, and click the button. This will bring up a dialog allowing you to specify the connection information.
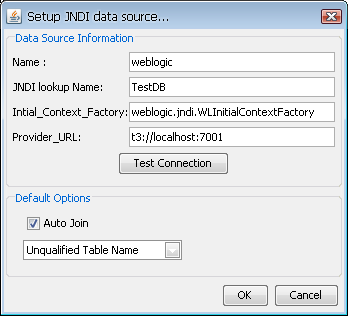
JNDI Setup Dialog
The first option allows you to specify a display name for the data source. The second option allows you to specify the JNDI lookup name for the data source. The third allows you to specify the initial context factory for the data source, and the last option allows you to specify the provider URL. This information will vary depending on the application server you're using as different vendors implement JNDI data sources differently. You can test the connection by clicking the button.
Once you have added a database, a new node for your database will appear in the Data Source Manager window. When you expand the node you will see two more nodes, one called Queries and one called Data Views. These are the two ways to retrieve data from your database. To create a new query, select the Queries node and click the button. A dialog will come up prompting you to specify a query name, and select whether you would like to enter the SQL statement as text, or launch the Query Builder.
If you select to enter an SQL statement, a dialog box will come up allowing you to type in your SQL statement. From this dialog, you can also load a QRY or text file containing SQL text, or execute a stored procedure. If you select to launch the Query Builder, the Query Builder will open in a new window, allowing you to construct the query visually. After you have finished building or entering the query, you will return to the Data Source Manager window and the query will appear as a new entry under the Queries node for your database.
The Query Builder is an integrated utility that allows you to construct queries against relational databases in a visual environment. To launch the query builder, add a new query within the Data Source Manager, and select the Open Query Builder option. The Query Builder will then open in a new window. You can also launch the query builder to modify an existing query by double clicking the query name in the Data Source Manager.
The main Query Builder window consists of two parts. The top half of the window contains all of the database tables selected for the queries, and their associated columns. The top window also shows what joins have been set up between column fields. The lower half of the main window or QBE (query by example) window contains the columns that have been selected or built for the query, and their associated conditions.
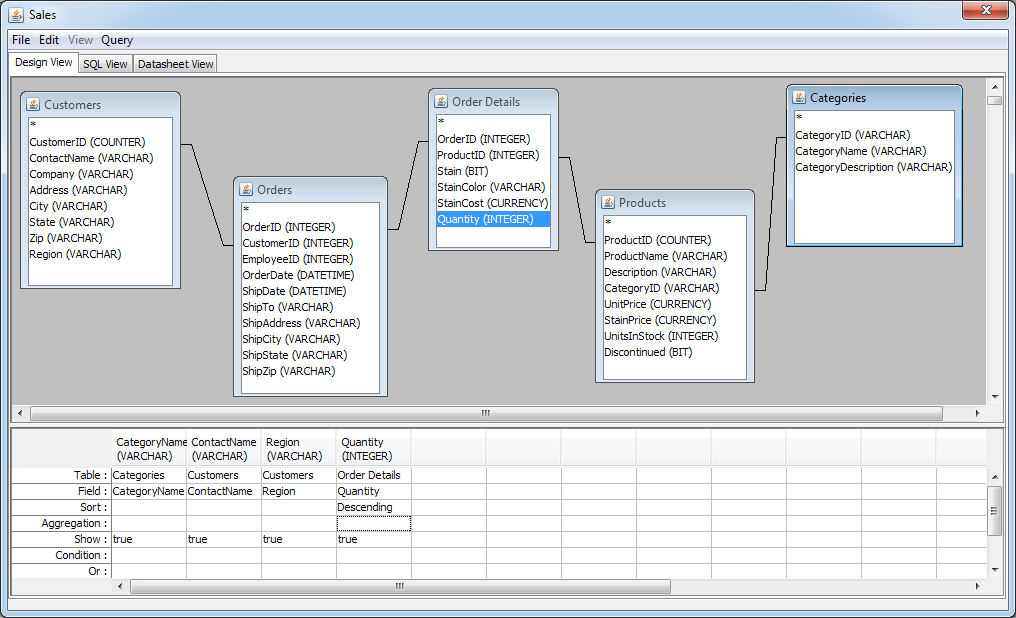
Query Builder Window
There are three tabs at the top of the Query Builder window. These allow you to toggle between different views. The Design View tab is the main designer window described above. The SQL View tab shows the SQL statement that is generated by the current query. The Datasheet View tab shows the query result.
When you have finished constructing the query, select Done from the File menu to return to the Data Source Manager.
When the Query Builder first launches, a tabbed window will appear, containing a list of all the tables within the database. A second tab contains a list of all the views in the database, and a third tab contains a list of other queries you have designed for the database under a heading called Queries. From this window, you can select the tables/views/queries from which you would like to build the query. You can also load a previously designed query as a table. To add a table, select it and click the button, or double click on the table name. When a table is added it will appear in the main Query Builder window, and will show all of the columns within that table. To remove a table, right click within the table and select Delete from the pop-up menu. You can also specify a table alias, and sort the fields alphabetically from this menu. You can close the tables window, by clicking on the button. To re-open it, select Show Tables from the Query menu.
| Note |
|---|---|
By default, the tables will appear using the name format you specified when setting up the database connection. You can change the naming by selecting Table Name Format from the Query menu. |
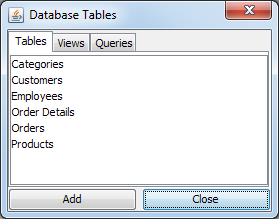
Query Builder Tables Window
When you select database tables for the query, the Query Builder can auto-detect joins between column fields, based on primary key-foreign key relationships in the database. Auto-joins will be added depending on which option you selected when setting up the database connection. Auto-joins will create a standard join between tables. A join is represented by a line drawn between two fields in the top half of the design window. To remove a join or edit join properties, right click on the line and select your choice from the pop-up menu. To add a join, click and drag one column field to another in a different table. A join will then appear. You can change the auto-join settings by selecting Auto Join from the Query menu.
- Join Properties:
Selecting Join Properties from the pop-up menu will bring up three options allowing you to select the type of join used between the column fields. Query Builder only supports equi-joins. Inequality joins can be easily accomplished using the conditions field. You can specify inner joins, left outer joins, and right outer joins. See the examples below for an explanation of the different join types.
Suppose you have the following two tables: Customers and Orders
| CustomerID | CustomerName |
|---|---|
| 1 | Bob |
| 2 | Ivan |
| 3 | Sarah |
| 4 | Randy |
| 5 | Jennifer |
| OrderID | CustomerID | Sales |
|---|---|---|
| 1 | 4 | $2,224 |
| 2 | 3 | $1,224 |
| 3 | 4 | $3,115 |
| 4 | 2 | $1,221 |
An inner join on CustomerID on the two tables will result in combining rows from the Customers table and those from the Orders table such that each row from the Customers table will be “joined” with all the rows in the Orders table with the matching CustomerID value. Rows from the Customers table with no matching CustomerID fields from the Orders table will not be included in the query result set.
Now suppose you create a query by selecting the OrderID, CustomerName, and Sales fields with an inner join on the CustomerID field. The select statement generated by the Query Builder would look like this:
Select Orders.OrderID, Customers.CustomerName, Orders.Sales
From Customers, Orders
Where Customers.CustomerID = Orders.CustomerID
Order by Orders.OrderID;
The result of the query is shown below:
| OrderID | CustomerName | Sales |
|---|---|---|
| 1 | Randy | $2,224 |
| 2 | Sarah | $1,224 |
| 3 | Randy | $3,115 |
| 4 | Ivan | $1,221 |
As you can see, the CustomerName entries “Bob”, and “Jennifer” do not appear in the result set. This is because neither customer has placed an order. There are situations where you may want to include all the records (in this example customer names) regardless whether matching records exist in the related tables(s) (in this case the Orders table). You can achieve this result using outer joins.
The Query Builder gives you the option of either right or left outer joins. The keywords “right” and “left” are not significant. It is determined by the order that the tables are selected in the Query Builder. If the outer table (the one that will have all records included regardless of matching join condition) is selected first, then Query Builder will use a right outer join. If the outer table is selected after the other join table, a left outer join is used. In our example, the Customers table has been selected before the Orders table, hence to select all of the records from the CustomerName field, the Query Builder will use a right outer join on the CustomerID fields.
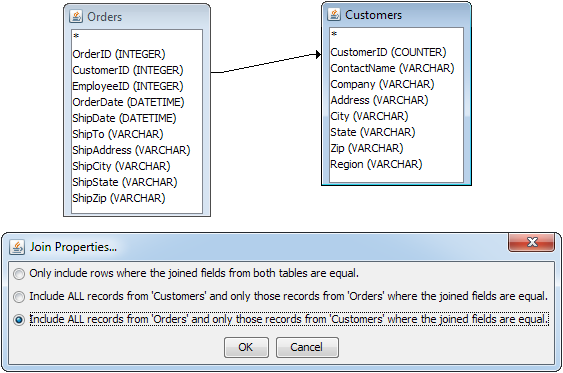
Join Properties Dialog
Now, using the previous example, suppose you create the same query as before, except this time specifying to include all of the records from Customers. The select statement generated by the Query Builder would look like this:
Select Orders.OrderID, Customers.CustomerName, Orders.Sales
From Orders right outer join Customers on Orders.CustomerID = Customers.CustomerID
Order by Orders.OrderID;
The result of the new query is shown below:
| OrderID | CustomerName | Sales |
|---|---|---|
| Jennifer | ||
| Bob | ||
| 1 | Randy | $2,224 |
| 2 | Sarah | $1,224 |
| 3 | Randy | $3,115 |
| 4 | Ivan | $1,221 |
As you can see, all of the customer names have now been selected, and null values have been inserted into the result set where there are no corresponding records. If you specify an outer join, the join line connecting the two tables in the Query Builder will become an arrow in the direction of the join.
The QBE window contains information on column fields selected for the query, as well as any conditions for the selection.
- Selecting Column Fields:
You can add column fields to the query from any table that has been selected in one of two ways. You can double-click on a field name within a table to add it to the query, or you can double-click on the Table or Field fields to bring up a drop-down menu with field choices. You can remove a column from the query by right clicking in the lower window, and selecting Delete Column from the pop-up menu, or by selecting Delete Column from the Edit menu. Once you have selected a column field, you can specify how you would like to sort the column, either ascending or descending by double clicking on the Sort field. You can also specify group by or column aggregation by double clicking on the Aggregation field. Aggregation options include: group by, sum, average, min, max, count, standard deviation, variance, first, and last. If you select group by for one column, then you are required to specify group by (or aggregation) for all of the other columns. To specify a column alias, right click on the column and select Alias from the pop-up menu. You can perform a
SELECT DISTINCToperation, by selecting the Select Distinct option from the query menu.- Building Columns:
To build your own column, right click on a blank column in the QBE window. Select Build from the pop-up menu. This will launch the Formula Builder. The Formula Builder allows you to construct columns in a visual environment using the tables that you have selected, and the formula library for the database that you are using. You can click the button to see the first few records of data for any field in your query.
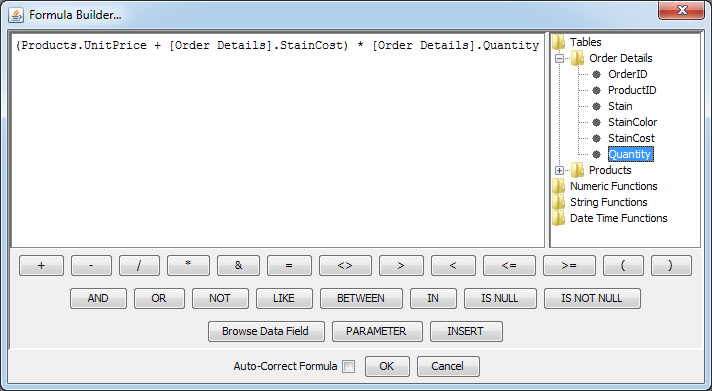
Formula Builder Window
- Conditions:
You can place conditions on the query selection by entering them in the Condition or Or fields. A condition placed in the Condition field creates an
ANDclause within the generated SQL. A condition placed in the Or field creates anORclause within the SQL. Right clicking in either field, and selecting Build from the pop-up menu, will bring up the Formula Builder. In the Formula Builder, you can specify standard conditions,=, <, >, BETWEEN, LIKE, NOT,etc., as well as construct formulas to filter the query. You can also specify a query parameter here.Note ERES can auto-correct items entered as query conditions, by appropriately appending the field name, and encasing string arguments in quotes. For examples, if you enter
= ARC, ERES will change the query condition toCategories.CategoryName='ARC'. If you're using complex functions (i.e. database functions that take multiple string arguments), ERES may not be able to properly parse the function. You can turn off the auto-correct feature by un-checking the box at the bottom of the formula builder window.
The formula builder component in the query builder allows you to use database specific functions when building a column or condition for the query. You can use the functions that are supplied or add your own to the interface.
ERES comes with the function libraries for Oracle, Access, MS SQL, and DB2 pre-loaded. They are stored in XML format in the DatabaseFunctions.xml file in the userdb directory. For databases with functions not stored in XML, ERES will use default ones. You can specify different database functions by editing the XML file, or creating a new one based on the DatabaseFunctions.dtd file in the userdb directory. A sample database functions file might look like the following:
<DatabaseFunctions>
      <Database ProductName="ACCESS">
            <FunctionSet Name="Numeric Functions">
                  <Function>Abs(number)</Function>
                  <Function>Atn(number)</Function>
            </FunctionSet>
      </Database>
</DatabaseFunctions>
Sometimes it is necessary to add extra SQL statements to run before or after a query. For example, you may need to set a transaction level or call a stored procedure before executing a query, and/or commit a transaction or drop a temporary table after executing a query. The query builder allows you to specify these extra SQL statements by selecting Extra SQL from the Query menu. This will bring up a window allowing you to write statements to execute before and/or after a query.
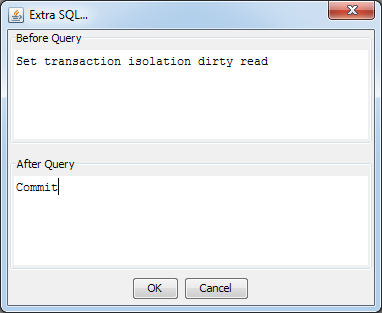
Extra SQL Dialog
You can enter any SQL statements you would like to run before and/or after the query in the appropriate boxes. When you have finished, click and the statements will be added to the query.
The SQL View and Datasheet View tabs let you see two different views of the query.
- SQL View:
The SQL View tab shows you the SQL statement generated by the query in the design view. It allows you to see how the Query Builder is translating the different operations into SQL. You can edit the generated SQL, however, if you change the SQL and then return to the Design View, any changes will be lost. If you save a query after changing the SQL, then the query will re-open to the SQL View tab if you select to edit it.
- Datasheet View:
The Datasheet View tab shows you the query result in data table form (this tab is also available in the Enter SQL dialog). The datasheet view will show you all of the data that is drawn as a result of executing the query. Going to the datasheet view will also test the query to check for design errors. You can navigate the query result by using the toolbar at the bottom of the window.
 Go to the first page of the data table
 Go to the previous page of the data table
 Go to a specific row of data (rows begin with 0)
 Go to the next page of the data table
 Go to the last page of the data table
 Set number of rows to display per page (default is 30)
- Exporting Queries:
You can export queries in one of two ways. You can output the SQL statement as text, or you can output the query result as a CSV file. To export a query, select Export from the File menu. A second menu will appear giving you the option to Generate SQL or Generate CSV, select the option that you would like, and a dialog box will appear prompting you to specify the file name and location.
| Note |
|---|---|
To save the query, and exit the Query Builder, select Done from the File menu. |
You can also use the Query Builder to design parameterized queries. This feature allows the user to filter the data at run-time.
Query parameters can be defined when typing an SQL statement or using the Query Builder. They can also be defined when running data views (this is covered in the next section). A parameter is specified within an SQL statement by the ":" character. Generally the parameter is placed in the WHERE clause of an SQL Select statement. For example, the following SQL statement
Select * From Products Where ProductName = :Name
specifies a parameter called Name. The user would then be able to enter a product name at run-time, and only retrieve data for that product.
Within the Query Builder, you can specify a query parameter by right clicking on the Condition field, and selecting Build from the pop-up menu. The Formula Builder will open, allowing you to place a condition on the column.
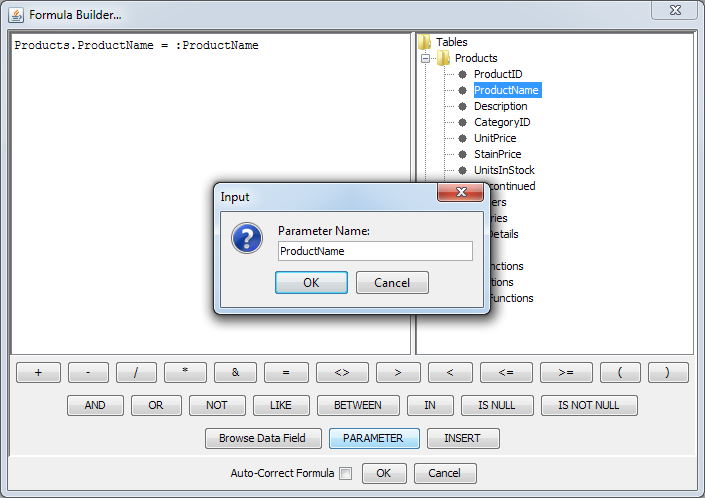
Specifying a Parameter in the Formula Builder
You can insert a parameter by clicking the button. A second dialog will appear prompting you to specify a name for the parameter. Type the parameter name, click and then click again to close the formula builder. You can specify as many different parameters as you would like for a query.
ERES supports a special kind of parameter that takes an array of values as the input rather than a single value. Multi-value parameters are useful when you want to have the user filter the result set based on an unknown number of values. For example, say a report is run to return a list of customers for a specific state/province. Users could select as many different states/provinces as they wanted and return the relevant information.
To create a multi-value parameter, place a parameter within an IN clause in an SQL statement. For example the following query
Select Customers.Company, Customers.Address, Customers.City, Customers.State, Customers.Zip
From Customers
Where Customers.State IN (:State);
will create a multi-value parameter named State. Multi-value parameters will only be created when there is only one parameter in the IN clause. If you place more than one parameter in the IN clause i.e. Customers.State IN (:State1, :State2, :State3). This will create three single value parameters instead.
When you attempt to save (by selecting Done from the File menu), or preview (by clicking the Datasheet View tab) a parameterized query, you will first be prompted to initialize the parameter. You can also initialize it by selecting Initialize Parameters... from the Query menu, or by clicking the button in the Enter SQL Dialog.
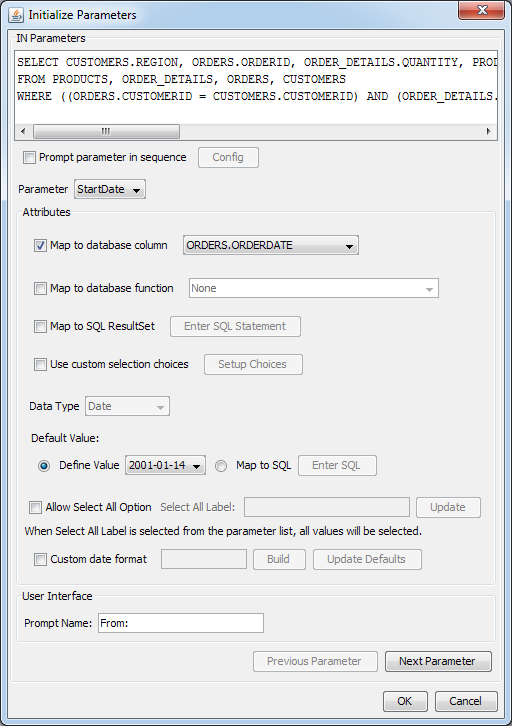
Initialize Parameter Dialog
From this dialog you can specify the following options:
- Map to database column:
This allows you to specify a column from the database whose values will be used for the parameter input. Selecting this option modifies the parameter prompt that the end user will get when previewing or running the report in the Report Viewer. If you map the parameter to a database column, then the user will be prompted with a drop-down list of distinct values from which to select a parameter value. If you do not map, the user will have to type in the specific parameter value.
![[Tip]](../../../images/tip.png)
Tip Normally this drop-down list is populated by running a select distinct on the column while applying the joins and conditions from the query. If you would prefer to get all the data from the column without constraints (sometimes this can improve the performance of the parameter prompts), you can set the Distinct Parameter List Selection option in the Admin Console. For more information about ERES server options see Section 1.4.1.3 - Server Options.
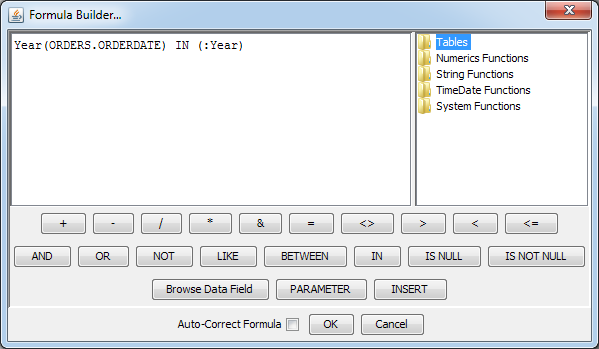
- Map to database function:
The map to database column feature is very handy for the end user to enter a valid value for a parameter from a list box. But what if the data the user wants is not the exact value from the database column. Rather it is something computed or derived from the value in a database column. For example, you want to find all the orders for year 2007. However, OrderDate is a date. What you want is to apply the Year function to the OrderDate column. This is the impetus behind this feature. Mapping a parameter to a database function is very similar to mapping to a column. In the formula builder, enter a condition comparing a function result to a parameter as shown below:
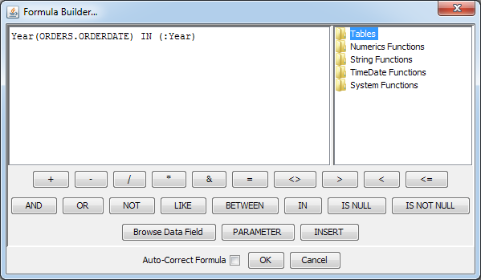
Condition for Mapping to Database Function
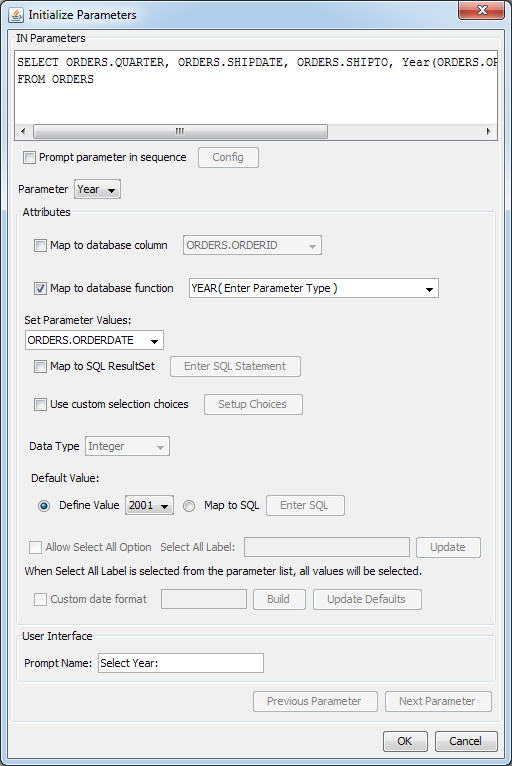
In the initialize parameter dialog, check the Map to database function box and the values will be automatically filled in.
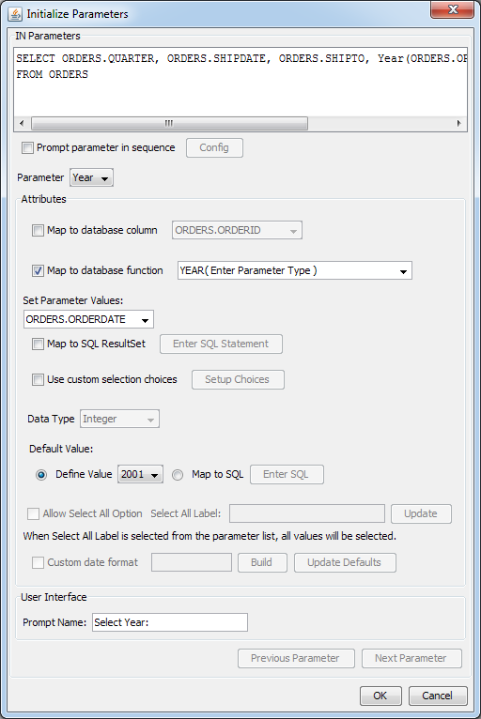
Map Parameter to Database Function
The list of custom functions is extracted from the
DatabaseFunctions.xmlfile located in the<ERES Install>/userdb/directory. Modify the.xmlfile if you wish to add a new database or add custom functions. The new functions will appear in this list when you restart the program.If your database is not listed in the
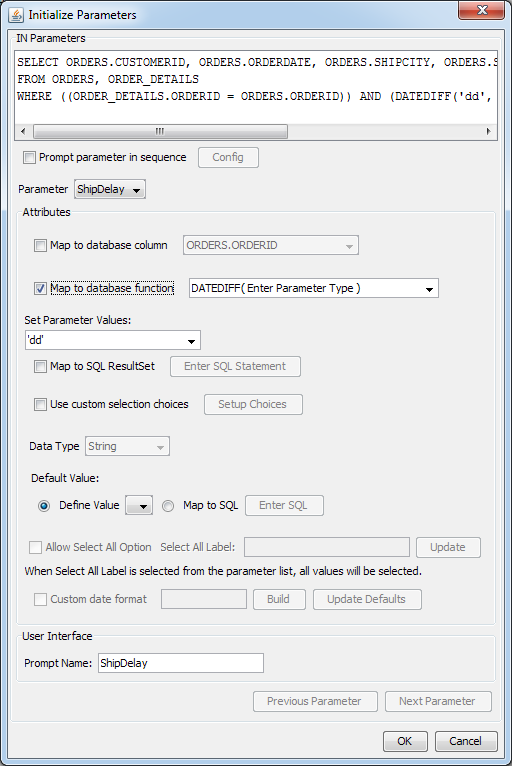
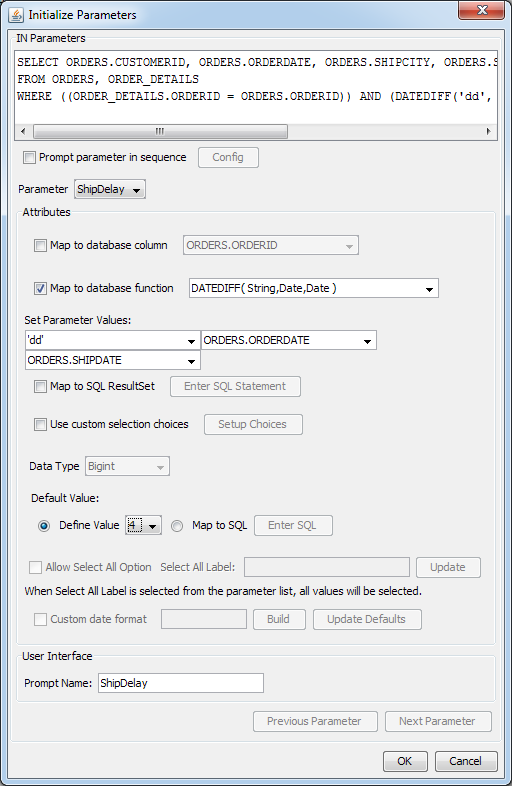
.xmlfile, the function list will be populated by functions listed in the JDBC driver. However, the function parameters are not provided. For example, the HSQL database is not listed in the.xmlfile.An interesting example using the HSQL database is as follows. Suppose you would like to create a report for orders that were delayed. You can utilize the HSQL DateDiff function to find the number of days for the order to ship.
DATEDIFF('dd', ORDERS.ORDERDATE, ORDERS.SHIPDATE) >= :ShipDelayThis function finds the difference between the order date and the ship date and displays the result in terms of days. If you initialize the parameter and check map to database function, the following prompt would be shown.
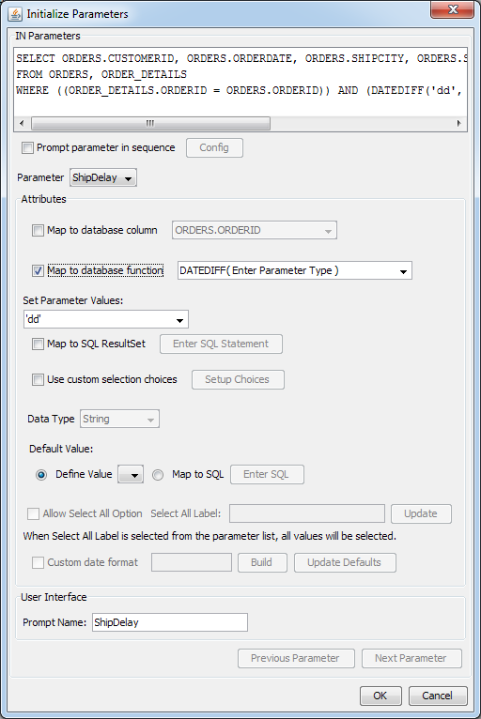
No Parameter Types for HSQL Function
The
DateDifffunction takes a string, and two date values for the parameters. Enter these parameter types in the parentheses. This will bring up three set parameter value lists. Enterdd(day) for the first parameter, selectOrders.OrderDatefrom the list for the second parameter, and selectOrders.ShipDatefrom the list for the third parameter. The default values will be updated with the function results.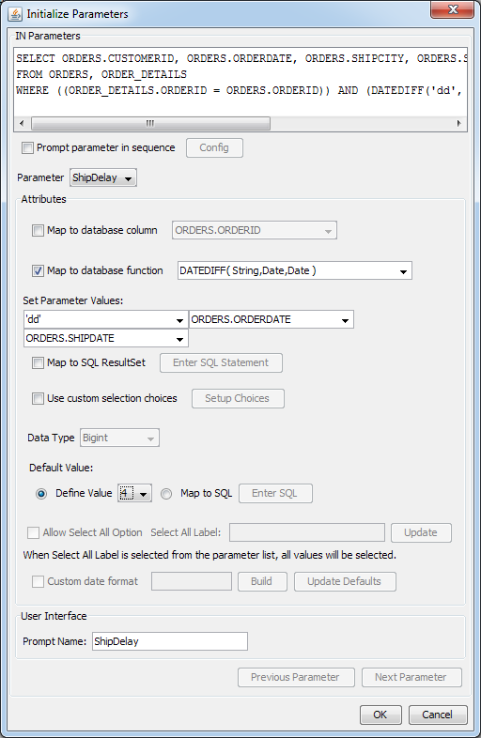
Map Parameter to HSQL Function
- Map to SQL ResultSet:
A parameter mapped to a database column will give you a list of distinct values in a drop-down list box for the user to choose when running the report. However, to produce the list of values, a select distinct on the column with the joins and conditions from the query will be run. In some cases, this can be a time-consuming process. To obviate this problem, and in fact to gain complete control as to what and how to populate the drop-down list box, you can write your own select statement to populate the drop-down list. An added bonus is that parameters that are in the query can be included in this query. With proper joins and parameters included, you can use this feature to facilitate cascading parameters (See Section 2.4.3.2.2.3 - Cascading Parameters). An example is as follows:
Suppose you have two parameters in the query. So, your query is as follows:
SELECT CATEGORIES.CATEGORYID, PRODUCTS.PRODUCTNAME, PRODUCTS.UNITPRICE, PRODUCTS.UNITSINSTOCK
FROM PRODUCTS, CATEGORIES
WHERE ((PRODUCTS.CATEGORYID = CATEGORIES.CATEGORYID))
AND (((CATEGORIES.CATEGORYID =:category) AND (PRODUCTS.PRODUCTNAME =:product)))
In the
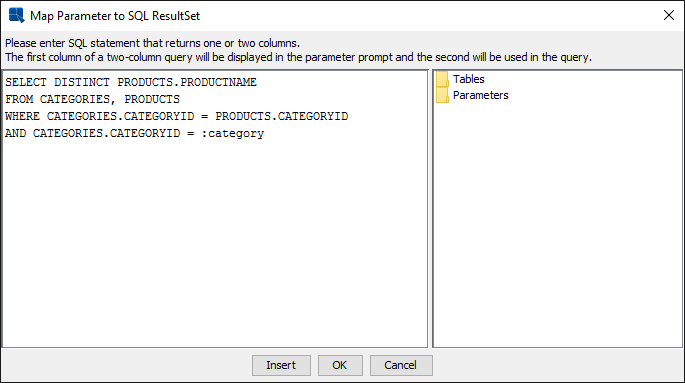
configprompt ininitialize parameter, set the order for parameter prompting tocategoryfirst, thenproduct.The select statement for parameter
categorycan simply be the following.SELECT DISTINCT CATEGORIES.CATEGORYID FROM CATEGORIESThe select statement for parameter
productwill be as shown below.SELECT DISTINCT PRODUCTS.PRODUCTNAME FROM CATEGORIES, PRODUCTS WHERE CATEGORIES.CATEGORYID = PRODUCTS.CATEGORYID AND CATEGORIES.CATEGORYID = :category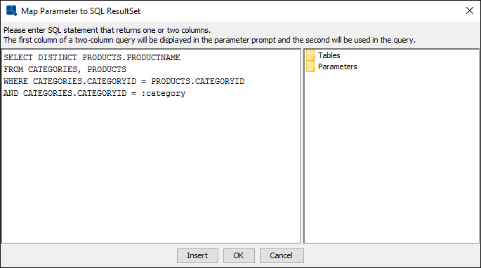
Select Statement for Product
When the user runs the template,
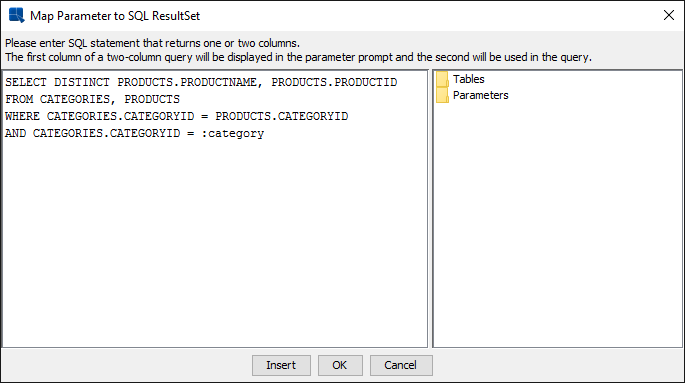
categorywill be prompted first. Then the value ofcategorychosen will be used to filter forproduct.The select statement mapped to a parameter can have either one or two columns in the select list. It is clear that if one column is in the select list, it must be the column that supplies list of distinct values for the parameter. Another useful feature provided here is that you can actually select two columns in the select list such that one of the columns will supply values for the drop-down list while the other column will be the actual parameter value for the filter condition. Consider the following example.
Suppose your database has a table with product ID as the primary key. When your end user wants to search for products from the database, they would like to use the product name as parameter since a product ID could be just a cryptic code. Using this feature, you can choose product name for the values in the drop-down list while product ID as the actual value filter condition.
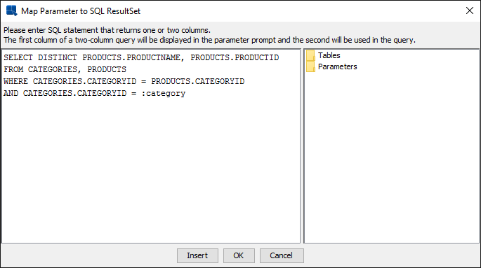
Select Statement with Two Columns
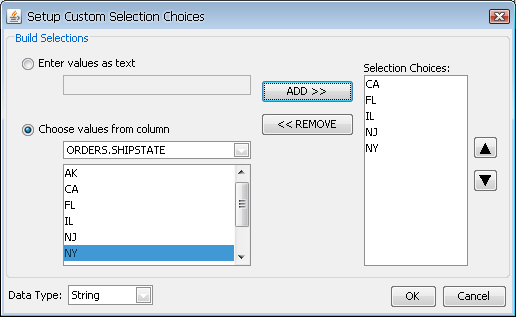
- Use custom selection choices:
Rather then having a drop-down menu with all the distinct column values, you can build a custom list of parameter values for the end user to select from as well. To set up the list, select this option and click the button. This will launch a new dialog allowing you to create a list of choices.

Custom Parameter List Dialog
In this dialog, you can either enter the custom values, or select the values from the distinct values of a column in the database. Once you have finished specifying the values for the list, click and the choices will be saved.
- Default Value:
This allows you to specify a default value for the parameter. Although you don't have to specify a default value, it is recommended that you do so. If you do not supply a default value you cannot open or manipulate the report template without the data source present.
You can either select a single value manually (either choose it from a list or type it manually, it depends on the mapping method you've chosen) or map the default value to a SQL query.
For multi-value parameters (see Section 2.4.3.2.2.1 - Multi-Value Parameters), the SQL query can return more than one value. In such case, several values will be chosen as default parameter values.
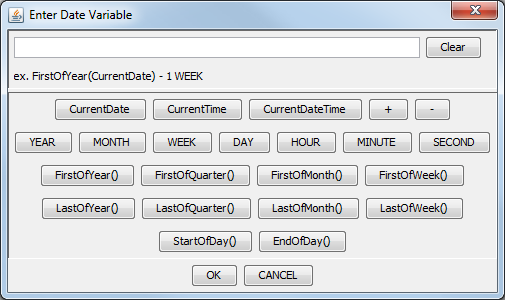
- Date Variable:
This option is only available when the parameter is not mapped to a database column or function, or mapped to a SQL resultset and not set to a custom selection choice. This option is only intended for parameters with variable type date/time. When you click this button the following panel will pop up, listing all the supported keywords.

Enter Date Variable Dialog
This dialog allows you to select one of the three keywords:
CurrentDate,CurrentTime, andCurrentDateTime. You may add or subtract units of time from the current date/time, allowing you to have a dynamic date range. For example, a report may have the following default values:StartDate: CurrentDate - 1 WEEK EndDate: CurrentDateThis would indicate that every time the report is run, the default prompt should be one week ago to the current date. Other supported measures are
YEAR, MONTH, DAY, HOUR, MINUTE, andSECOND. This feature only supports a single addition or subtraction. This feature does not support multi-value parameters.You can also use functions to define the parameter value:
- FirstOfYear()
Argument format:
CurrentDate,CurrentDateTime, e.g.FirstOfYear(CurrentDate)The function returns a date of the first day of the year from the argument. For example, when the argument evaluates to
2012-08-14the function returns2012-01-01.- LastOfYear()
Argument format:
CurrentDate,CurrentDateTime, e.g.LastOfYear(CurrentDate)The function returns a date of the last day of the year from the argument. For example, when the argument evaluates to
2012-08-14the function returns2012-12-31.- FirstOfQuarter()
Argument format:
CurrentDate,CurrentDateTime, e.g.FirstOfQuarter(CurrentDate)The function returns a date of the first day of the quarter which includes the date from the argument. For example, when the argument evaluates to
2012-08-14the function returns2012-07-01.- LastOfQuarter()
Argument format:
CurrentDate,CurrentDateTime, e.g.LastOfQuarter(CurrentDate)The function returns a date of the last day of the quarter which includes the date from the argument. For example, when the argument evaluates to
2012-08-14the function returns2012-09-30.- FirstOfMonth()
Argument format:
CurrentDate,CurrentDateTime, e.g.FirstOfMonth(CurrentDate)The function returns a date of the first day of the month from the argument. For example, when the argument evaluates to
2012-08-14the function returns2012-08-01.- LastOfMonth()
Argument format:
CurrentDate,CurrentDateTime, e.g.LastOfMonth(CurrentDate)The function returns a date of the last day of the month from the argument. For example, when the argument evaluates to
2012-08-14the function returns2012-08-31.- FirstOfWeek()
Argument format:
CurrentDate,CurrentDateTime, e.g.FirstOfWeek(CurrentDate)The function returns a date of the first day of the week which includes the date from the argument. For example, when the argument evaluates to
2012-08-14the function returns2012-08-12(Sunday is taken as the beginning of the week).- LastOfWeek()
Argument format:
CurrentDate,CurrentDateTime, e.g.LastOfWeek(CurrentDate)The function returns a date of the last day of the week which includes the date from the argument. For example, when the argument evaluates to
2012-08-14the function returns2012-08-18(Saturday is taken as the end of the week).- StartOfDay()
Argument format:
CurrentTime,CurrentDateTime, e.g.StartOfDay(CurrentDateTime)The function returns a time of the start of the day from the argument. For example, when the argument evaluates to
2012-08-14 12:15:03the function returns2012-08-14 00:00:00.0.- EndOfDay()
Argument format:
CurrentTime,CurrentDateTime, e.g.EndOfDay(CurrentDateTime)The function returns a time of the end of the day from the argument. For example, when the argument evaluates to
2012-08-14 12:15:03the function returns2012-08-14 23:59:59:999.
- Data Type:
This allows you to specify the data type for the parameter value(s). If you have mapped the parameter to a column, then the data type is set automatically.
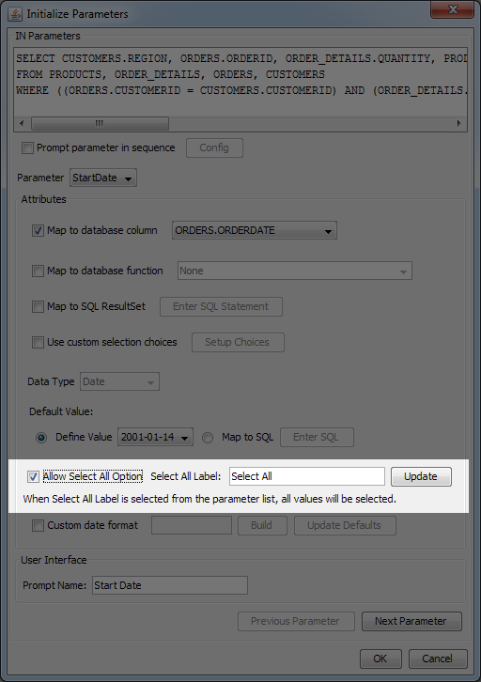
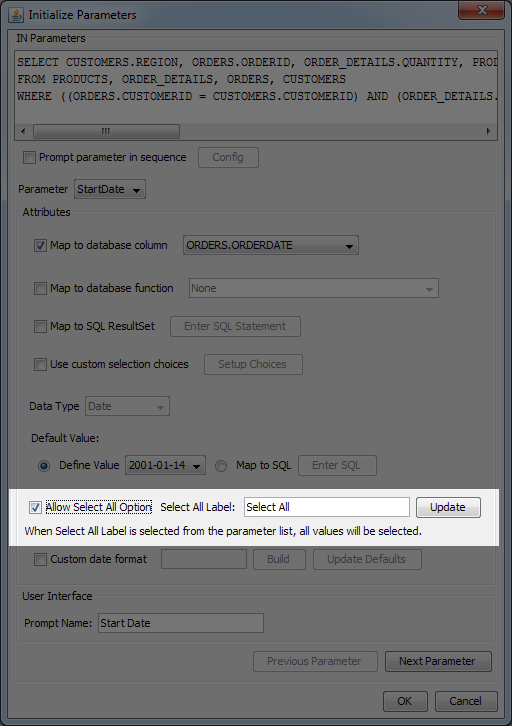
- Allow Select All Option:
Use this to add an option to the parameter prompt dialog that allows users to select all parameter values even for single-value paramters. See the Section 2.4.3.2.2.4 - All Parameters for more details.
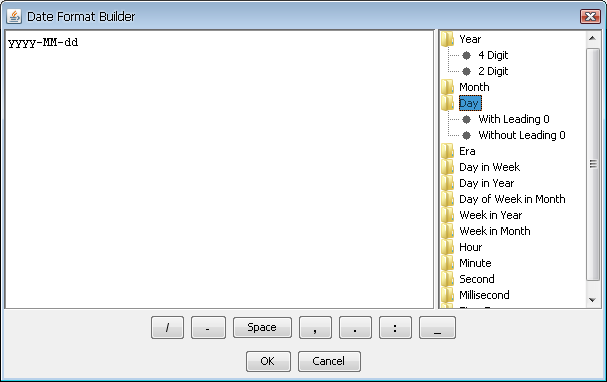
- Custom Date Format:
This allows you to set the format in which the date parameter should be entered. This option is only available when the data type is either date, time, or timestamp and the parameter is either mapped to column or not mapped at all.
When you check this option, the default custom date format is shown. These defaults can be changed in the admin console see Section 1.4.1.3 - Server Options. Please note that the default date format only applies for database data sources. The date format is built using a combination of characters that represent date/time elements. You can build the format easily using the date format builder by clicking on the build button.
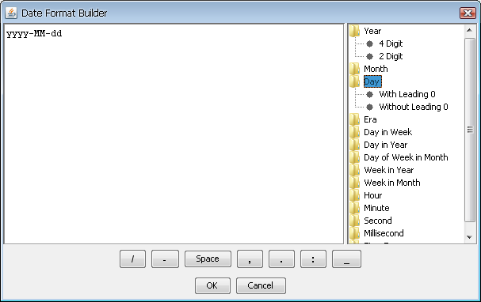
Date/Time Format Builder
The builder contains a list of elements available on the right, you can mouse over the elements to see an example of each presentation. The bottom section contains a set of separators available for use.
You can also type in the format by hand either in the builder or directly in the Custom Date Format input box. For more on the characters and their formatting, please refer to the documentation for the printDate() report function in Section 3.6.2.8.3 - Date/Time Functions. Formatting for this option is the same as for the format argument of the function.
- Prompt Name:
This allows you to specify the prompt that is given to the user in the parameter dialog.
If you map the parameter, the user will see either a drop down box (single value parameter) or a list box (multi-value parameter) containing the various options. If you choose not to map the parameter, the user will see a text box to enter their own value. In the case of a multi-value parameter, it is recommended to let the user know in the parameter prompt that this parameter accepts multiple values. Users can separate multiple values using a comma (e.g. ARC, DOD, TRD). If the text requires the user of a comma, the user can use quotes to include the comma within the filter string (e.g. "Doe, John", "Smith, Mike").
Clicking on the and the buttons allow you to initialize each of the parameters that have been defined in the query.
When you select to use a parameterized query to design a report, or open a report that uses a parameterized query, the report will load/start with the default values. You will be prompted to provide parameter values when you preview the report.
By default, the user is prompted to enter all of the report parameters at once in the prompt dialog. This configuration, however, may not be the best approach if some parameters are mapped to database columns with a significant number of distinct values. It can be difficult to select from a very large list, and depending on the parameter combination, users may be able to select sets that don't return any data.
To assist with these problems, ERES provides a feature that allows the user to configure the order in which the parameters should be entered. With this feature enabled, the user enters parameters in the dialog in a pre-defined order. As such each selection will be applied as a filter to the next parameter prompt(s). Using cascading parameters can limit the number of distinct values presented to the user, and can prevent the user from selecting invalid parameter combinations.
To enable cascading parameters, check the option marked Prompt parameter in sequence in the parameter initialization dialog. Then click the button to set the order of the parameter prompts. A dialog will open showing all the parameters defined in the query.
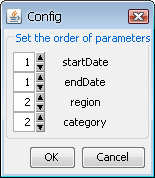
Parameter Sequence Dialog
Using the spin boxes, you can set the sequence for the query parameters. The user will be prompted starting with the lowest numbered parameter, and working up through the highest. If two or more parameters share the same number, the user will be prompted to enter those parameters at the same time (in the same dialog).
By default, the parameter values for the next level are generated by rerunning the entire query with the previously prompted parameters filled in. If the original query is slow to execute, you can improve performance by mapping higher order parameters to SQL Queries. You can even include previously selected parameter values in the mapped query. For more information, please see Section 2.4.3.2.2.2 - Initializing Query Parameters.
Please note that this feature can only be used with reports.
Sometimes, you want to select all parameter values at once. The All Parameters feature allows you to do so.
- Single-value parameters
It is possible to select all parameter values at one time even for parameters that don't allow mutli-value selection.
Note There is a difference between multi-value selection and all-value selection. See the Inner Workings chapter to learn more.
For example: Let's assume you have a condition like this:
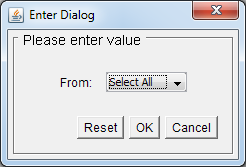
WHERE column = :ParameterIn such case, the parameter prompt dialog will not allow you to select more than one value.
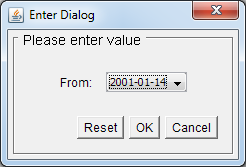
Typical single-value parameter
But you can use the Select All Values feature to add an option to the parameter value list that will allow viewers to select all parameter values at once (even if the parameter doesn't allow multi-value selection).
Single-value parameter with the Select All functions enabled
The Select all feature, can be enabled on the Initialize Parameters dialog (see Section 2.4.3.2.2.2 - Initializing Query Parameters for more details) by selecting the Allow Select All Option check-box.
This option is available only for parameters that meet the following requirements:
The parameter uses one of the following operators. When there are multiple occurrences of this parameter in the query, all parameter comparison operators have to be one of these.
<
less than
<=
less than or equal to
>
greater than
>=
greater than or equal to
=
equal to
The parameter is mapped to the same column as the column from the parameter condition or the parameter isn't mapped to anything.
After you've selected the Allow Select All option, the Select All Label field activates allowing you to enter a text that will be used for selecting all data from the query. For parameters that are mapped to a column, this text will be displayed in the parameter value list in 1st place. For parameters that aren't mapped to anything, entering this text as the parameter value will result in selecting all data.
- Multi-value parameters
Unlike single-value parameters, the Select All feature is enabled for all multi-value parameters by default (in fact, it can't be disabled, because disabling it for multi-value parameters would make no sense). All you have to do to use this feature is to click on the
 Select All icon in the parameter prompt.
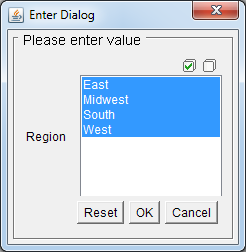
However, multi-value parameters can work in two modes:
If the parameter meets the conditions from the previous paragraph and the parameter is on the first cascading level (i.e. parameter cascading is disabled, or the parameter is on the first cascading level), it is parsed by the SQL parser and the parameter condition is nullified. Nullifying the parameter optimizes the query and prevents it from causing performace reduction or even errors. See the Inner Workings to learn more about how it works.
If the parameter doesn't meet the conditions from the previous paragraph, or if it's not on the first cascading level, selected values will be injected to the query as a comma separated list of values. If there is a large amount of values injected to the query as a list, the query can become quite long. Long queries can cause performance reduction or even errors, so it is not recommended to use this option for parameters with many values.
- Inner Workings
If a report/chart/map viewer chooses to select all parameter values for a single-value parameter or for a multi-value parameter that meets the conditions for parameter disabling, the query is then automatically parsed and a special condition is added to the parameter which basically disables the parameter.
For example: The following query
select *
from table
where column > parameter_value
Would be parsed and passed to the database as:
select *
from table
where ((column > parameter_value) OR (1 = 1))
This example also demonstrates another important thing: selecting all values for the < (less than) or > (greater than) operators returns all values from the table (if there are no other conditions) rather than returning no data at all (because condition like
WHERE <all data from the Date column> > Datewould return no data...).Because ERES allows you to use many database systems, parsing may fail for certain complex queries in certain databases. In such case a warning dialog will be displayed.
In such situations, you have the following three options:
Try to modify the query so it can be parsed by our parser.
Add your own Select all parameters condition to the query.
For example:
WHERE ((column = :Parameter) OR (:Parameter LIKE 'selectall'))Note If you embed the all parameter directly to the query, leave the Allow Select All Option option disabled.
Contact Quadbase support.
Typically, the Query Builder is recommended for creating queries. However, there are times when it is necessary to enter SQL statements directly, for example, if the query is already created in a QRY file, if the query is built into a stored procedure/function, or if the query requires commands not supported by the Query Builder. In these situations, select Enter SQL statement to open the Set SQL Statement window. Here, you can enter SQL statements directly into the text area as shown below or you can load an existing QRY File.
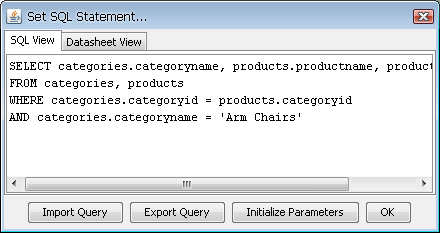
Enter SQL Statement Dialog
To preview the result set, click on the Datasheet View tab.
Compared to other database systems, Oracle uses a different approach when it comes to stored procedures and functions. For example, on MS SQL Server, using the EXEC command will return a result set. However, Oracle requires the use of an OUT parameter with a REF CURSOR type to return the result set. In addition, Oracle will not accept multiple statements from a single query. Therefore, it is necessary to store the query within a stored function and use special syntax to access the existing Oracle stored procedures.
To access your Oracle stored procedures the first step is to define a weakly typed REF CURSOR using the following PL/SQL statement.
CREATE OR REPLACE PACKAGE types
AS

      TYPE ref_cursor IS REF CURSOR;

END;
This ref_cursor type will be used to store the query result set and return as an OUT parameter. The next step is to create a function, which calls your stored procedure and executes your query. The following skeleton code will return a simple query using the ref_cursor type.
CREATE OR REPLACE FUNCTION my_function()

      RETURN types.ref_cursor

AS

      result_cursor types.ref_cursor;

BEGIN

      do_stored_procedure();
      OPEN result_cursor FOR
            SELECT * FROM Categories

      RETURN result_cursor;

END;
Now that the Oracle stored function is set up, it can be easily called from ReportDesigner using a special PL/SQL like syntax. In the Set SQL Statement window enter the following syntax to call the Oracle stored function:
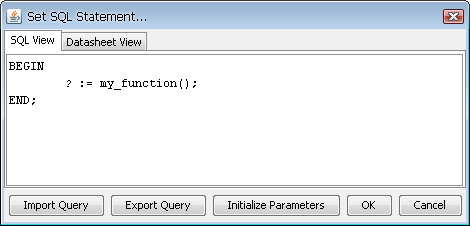
Calling simple Oracle stored function
The BEGIN ... END; syntax alerts the system that the user is trying to access an Oracle stored function. And the “?” notifies the ReportDesigner that a variable is reserved for the OUT parameter. The JDBC syntax for calling Oracle stored procedures is as follows:
( call ? := my_function() )
However, ERES does not support this format. Preview the results by clicking the Datasheet View tab.
Here is a more practical example to illustrate how stored procedures can be used with ERES to develop useful solutions. Suppose you have a table called employee_table that stores an organization's location hierarchy such as the one shown here:
| ID | NAME | PARENT | EMPLOYEE |
|---|---|---|---|
| 1 | All | NULL | 0 |
| 2 | America | 1 | 0 |
| 3 | Europe | 1 | 0 |
| 4 | New York | 2 | 20 |
| 5 | Santa Clara | 2 | 30 |
| 6 | Dallas | 2 | 12 |
| 7 | London | 3 | 14 |
| 8 | Paris | 3 | 11 |
The table lists the various corporate locations in a tree structure. The numbers of employees are stored in the leaf nodes (e.g. New York, London, etc.) and each node contains information about its immediate parent. Suppose you want to create a report that displays the number of employees in a certain region and information about the separate branches within that region. For example, if the user inputs ID = 2 (America), you want the report to display the total number of employees in America along with the branch locations. Using Oracle's CONNECT BY and START WITH clauses, the problem is solved with two simple Oracle Stored Functions:
CREATE OR REPLACE FUNCTION sum_employees(locID IN NUMBER)

      RETURN NUMBER

AS

      sum_emp NUMBER;

BEGIN

      SELECT sum(employee) INTO sum_emp
      FROM employee_table
      CONNECT BY PRIOR id = parent
      START WITH id = locID;

      RETURN sum_emp;

END;

CREATE OR REPLACE FUNCTION regional_employees (locID IN NUMBER)

      RETURN types.ref_cursor

AS

      result_cursor types.ref_cursor;

BEGIN

      OPEN result_cursor FOR
            SELECT id, name, sumEmployees(id) AS Employees
            FROM employee_table
            CONNECT BY prior id = parent
            START WITH id = locID;

      RETURN result_cursor;

END;
The function sum_employees takes the starting node as an argument and finds the sum of all leaf nodes that are descendents of that node. For example, sum_employees(3) returns 25 because there are 25 employees in Europe (14 in London, 11 in Paris). The second function, regional_employees, traverses through the tree structure starting with the locID and builds a result set from the ID, Name and the result from the sum_employees function. Then, the result set is returned through a REF CURSOR.
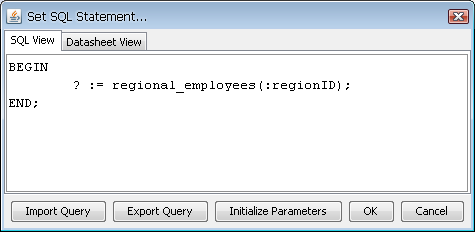
To call a stored function that requires an argument, enter the following statements in the Set SQL Statement window:
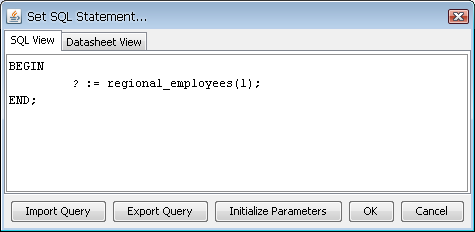
Calling regional_employees function
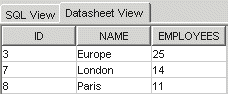
Preview the results by clicking the Datasheet View tab.
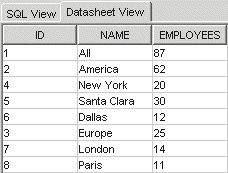
Result set from regional_employees
As seen from the results, the CONNECT BY clause traverses the tree recursively listing the American nodes together before listing the European nodes. If the user is only interested in the European locations, they can enter 3 for the parameter and the following result set would return.
Result set from regional_employees in Europe
To create a parameterized report, use the :param_name syntax. The SQL parser in ERES will be able to differentiate between the colon used for parameters and the one used for the assignment operator ( := ). Here is an example using parameters.
Calling Oracle Stored Function using Parameter
When using IN parameters, it is necessary to initialize the parameters prior to executing the query. It is especially important to set the correct default data type for executing stored procedures because the parameters cannot be mapped to existing columns. More information on initializing parameters can be found in Section 2.4.3.2.2 - Parameterized Queries.
To try this example, <ERESInstall>\help\examples\DataSources\database\locationHierarchyExample.sql contains the SQL commands to create employee_table as well as the two stored functions.
In addition to the query interfaces, ERES provides another means of retrieving database data - data views. Data views provide a simplified view of the database, in which users can design queries by simply selecting fields, without using the Query Builder, or having any knowledge of the underlying database structure. Using data views administrators can pre-define tables, joins, and fields, creating in effect a local schema for the user to select from.
For example, an administrator could set up a data view for the sales department. The appropriate database tables and fields are pre-selected, and grouped in a manner congruent with business users’ logic. For example a group called invoices would have the appropriate customer and order fields. End users would then select this data view, pick the pertinent fields, specify a date range, and then begin designing a report or chart.
To create a data view, select the Data Views node in the Data Source Manager window and click . A new window will open allowing you to select the database tables that you would like to use for the data view.
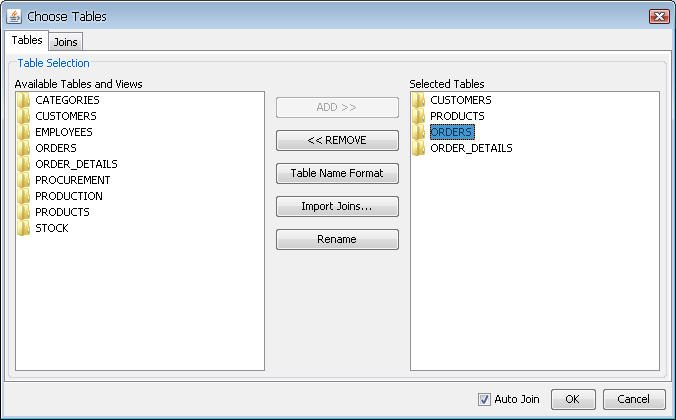
Data View Choose Tables Dialog
The left-hand window contains all of the available database tables and views. You can add a table by selecting it in the left-hand window, and clicking the button. By default, the data view will use the name format you specified when setting up the database connection. You can change the naming by clicking the button, or specify a table alias by clicking on the button. You can also import selected tables and joins from another data view by clicking the button.
The Joins tab of this window allows you to specify the joins between the selected tables.
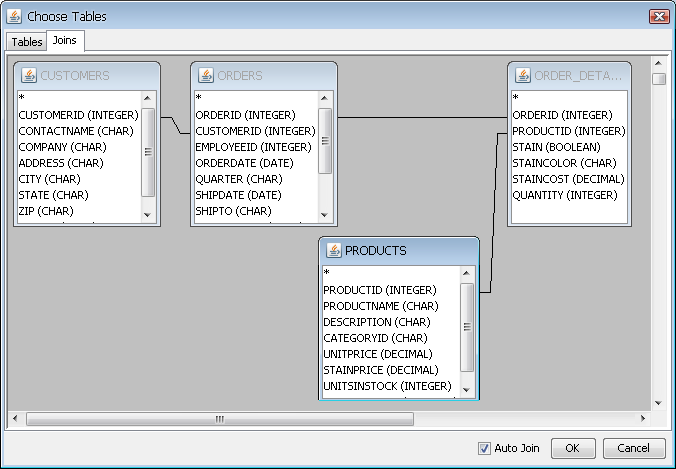
Data View Joins Dialog
The Joins tab shows all of the selected tables and their associated fields. The tables will be auto-joined depending on which option you selected when setting up the database connection. These auto-joins create a standard join between tables. A line drawn between two table fields represents a join. To remove a join or edit join properties, right click on the line and select your choice from the pop-up menu. To add a join, click and drag one column field to another in a different table. A join will then appear. Data views use the same join properties as the Query Builder. For more about join properties, please see Section 2.4.3.2.1.2 - Joins.
After you have finished selecting and joining tables, click and a new window will open allowing you to construct the data view.
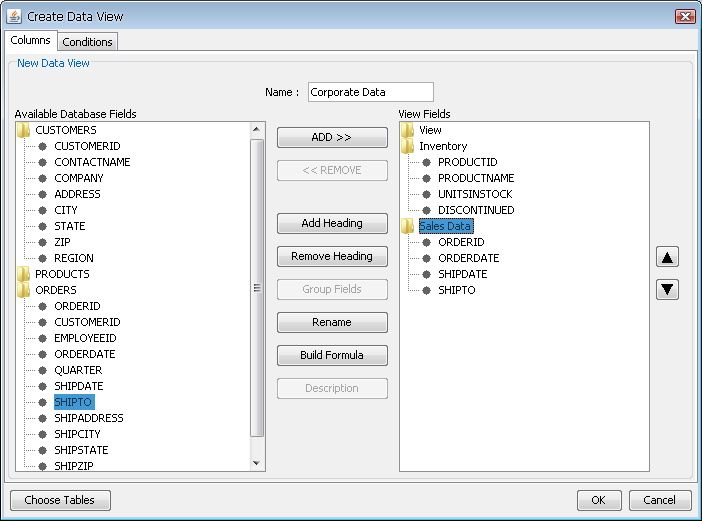
Create Data View Dialog
The left-hand window contains a list of tables you have selected, and their associated fields. Each folder signifies a table, and can be opened and closed by double clicking. The right-hand window contains fields that have been selected for the data view. To add a field to a data view, select it in the left-hand window, and click the button. Fields can be removed from the data view in the same manner by selecting a field in the right-hand window, and clicking the button. You can create a calculated column by clicking the button. This will open the formula builder allowing you to build the column. You can also define an alias by selecting any of the view fields in the right-hand window and clicking the button.
You can also group fields within the data view by adding headings. This allows you to create your own organizational structure of virtual tables that group data from different database tables under one heading. To create a heading, click the button. You will then be prompted to specify a name for the heading. The new heading will then appear as a folder in the right-hand window. To add fields under a heading, first select the fields you would like to add from the right-hand window, and click the button. You will then be presented with a drop-down menu, allowing you to select the heading under which you would like to add the fields.
You can add a description to any of the fields by first selecting the field and then clicking the button, or by double clicking on a field in the right-hand side of the window. This will bring up a new dialog allowing you to specify a description for the field. End users can then access these descriptions when running the data view.
The Conditions tab contains a formula builder window that allows you to specify certain filtering criteria for end users. Anything added in this window, will be added to the Where clause of the generated SQL. For more on using the formula builder, please see Section 2.4.3.2.1.3 - Columns.
When you have finished creating the data view, click the button, and the data view will be added to the Data Source Manager. Users can now use this view to construct ad-hoc queries.
When you design a report or chart using a data view as the data source (by selecting the data view and clicking the or button) a window will open allowing you to select which fields in the view you would like to use for the report. From this dialog, you can also build computed fields based on the available view columns.
After you have selected the fields, click and a new window will open allowing you to specify sorting, aggregation, and filtering conditions for the data view.
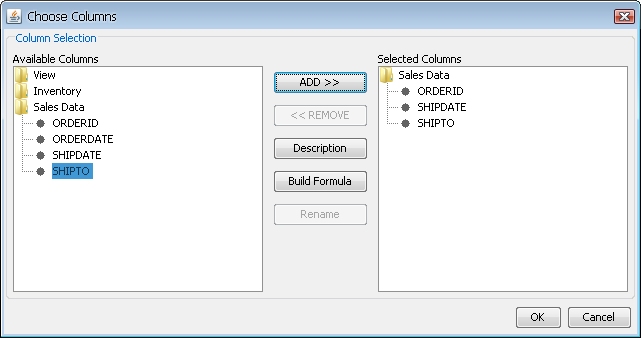
Data View Choose Fields Dialog
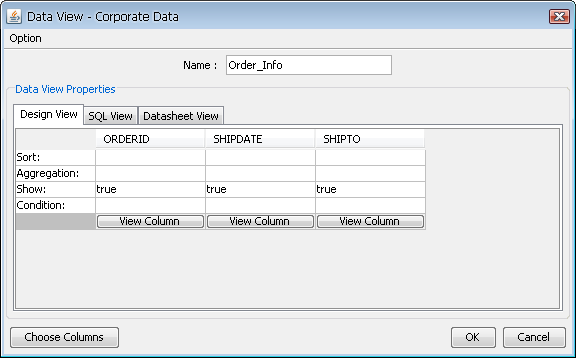
Data View Conditions Window
For each of the fields in the data view, you can specify sorting, aggregation, and conditions, by double clicking on the respective field. Sorting and aggregation can be selected from drop-down menus. Double clicking on the Conditions field brings up a new window that allows you to specify simple selection criteria like >, <, =, and between. Users can build more advanced filtering criteria by right clicking on the Conditions field and selecting Build from the pop-up menu. This will open the Formula Builder window allowing you to build a condition. You can also display all of the unique values in the column by double clicking on the button.
The Option menu in the upper left hand corner of the conditions window allows you to select a vertical/horizontal view for the conditions window, initialize any parameters in the data view, or save the query.
The selection set and conditions that you specify will be saved as a data view query with the name that you specify in the name field. Data view queries are saved under the node for the data view. A report created from the data view will reference the data view query for updating/modification.
As with Query Builder, users can specify query parameters in Data Views. To add a parameter to a data view, select a data view in the Data Source Manager, and click View to run the data view. After you have selected fields for the data view, and you are in the conditions window, right-click in the Condition field for a column, and select Build from the pop-up menu. This will bring up the formula builder, allowing you to specify a parameter in the same way as in Query Builder. For more on this, please see Section 2.4.3.2.2 - Parameterized Queries.
Once, you have entered the parameter, you will be prompted to initialize it if you go to the Datasheet View tab, you click to continue on with the report wizard, or if you save the selections as a query. You can also initialize the parameter by selecting Initialize Parameters from the Option menu.
Sometimes you may need to make changes to the structure/make-up of the data view as your data model, or requirements change. Changes could include adding/removing fields or re-naming them. You can propagate changes from the data view to its associated queries by selecting it in the data source manager, and selecting Data View Queries from the Update menu.
All of the queries associated with the view will be scanned, and any inconsistencies in fields or field names will be presented for you to update.
Update Query Fields Dialog
For each query, you will be prompted to change any fields that no longer match the data view structure. For each field, you can select a field from the data view to map it to, or remove the field from the query. If you want to leave the query alone, you can click the button. The query will continue to run, but it will reference the old data view structure. Click to save the changes to the data view query.
EspressReport ES allows you to filter data based on a user's security level when viewing a pre-built report. But what if the user is doing ad hoc querying and reporting, and you want to restrict data access based on user's security level. For this, EspressReport ES allows you to apply security filters to data views. This feature will automatically apply pre-specified filters to data views and data view queries when certain users run them through QuickDesigner. These options are configured through an XML file, and tie into the report-based secured parameter features. For more about secured report parameters, see Section 3.10.2.1 - Security Parameters.
To illustrate the concept, let us walk through a simple example. A sample data view security XML file is given here:
<?xml version="1.0"?>
<!DOCTYPE SecuredParamInfoList SYSTEM "QuickDesignerSecuredParameters.dtd">
<SecuredParamInfoList>

      <SecuredParamInfo>
            <Driver>org.hsqldb.jdbcDriver</Driver>
            <URL>jdbc:hsqldb:<ERESInstallDir>\help\examples\DataSources\database\woodview</URL>
            <TableName>CUSTOMERS</TableName>
            <ColumnName>REGION</ColumnName>
            <DataType>VARCHAR</DataType>
            <IsMulti state="true" />
            <SecLevel Name="EastSouth" GrantAll="false">
                  <Data>East</Data>
                  <Data>South</Data> </SecLevel>
            <SecLevel Name="Midwest" GrantAll="false">
                  <Data>Midwest</Data> </SecLevel>
            <SecLevel Name="West" GrantAll="false">
                  <Data>West</Data> </SecLevel>
            <SecLevel Name="East" GrantAll="false">
                  <Data>East</Data> </SecLevel>
            <SecLevel Name="South" GrantAll="false">
                  <Data>South</Data> </SecLevel>
            <SecLevel Name="Executive" GrantAll="true">
            </SecLevel> </SecuredParamInfo>

</SecuredParamInfoList>
This XML file defines a filter for the REGION column from the CUSTOMERS table in the Woodview sample database. It specifies the behavior of the filter for six different security levels. For level East the query will be automatically filtered so that only rows where region is East will be returned. For level South the query will be automatically filtered so that only rows where region is South will be returned. For the level Midwest only rows where the region is Midwest will be returned. For the level West only rows for West region will be returned. The IsMulti attribute allows you to indicate whether multiple parameter values can be specified for the filter, like in the case of the EastSouth level. For level Executive all values from the region column will be available.
The security levels specified in the XML file should match those that are defined in the Organizer. For more information about setting up security levels see Section 2.3.3 - Security Levels. The sample XML file — SampleQDSecuredParameters.xml, and the DTD, QuickDesignerSecuredParameters.dtd, that defines all of the specifications for the XML file can be found under <ERESInstallDir>/qDesigner.
To deploy a security filter XML file, you will need to modify the QB.properties file under the <ERESInstallDir>/WEB-INF/classes directory, and add a new server option (add it to the ServerCommands= line) -QuickDesignerSecuredParameters: followed by the relative or absolute path to your XML file. For more information about setting server options, see Section 1.4.1.3.1 - Secured Parameter. For this exercise, please add -QuickDesignerSecuredParameters:qDesigner/SampleQDSecuredParameters.xml to QB.properties.
With the XML file setup, any time a user creates or runs a data view or data view query that uses the field/table defined in the XML file, the filter defined for their security level will be applied. If the user then creates and saves a report in QuickDesigner, this filter will be converted to a secured query parameter in the finished report. Any changes to the security after this time, can be made by the Administrator through the Report Designer. For more information about report-level security, see Section 3.10 - Template Security. If the user does not belong to a security level, or their security level is not defined in the XML file then the user will not be allowed to run the query. Therefore, it is important to have security levels assigned to all groups or users who are allowed to use quick designer.
Sign in as admin and create 6 users, namely, exec,easternmanager,southernmanager,midwesternmanager,westernmanager, and eastsouthmanager. Assign them with design privilege. Then open the data registry and highlight sample.xml. Click on the button to assign privilege to allow read and write access to all these users.
Create 6 security levels in organizer (Note: security levels are case-sensitive):
Executive (assigned to the user exec)
East (assigned to easternmanager)
South (assigned to southernmanager)
Midwest (assigned to midwesternmanager)
West (assigned to westernmanager)
EastSouth (assigned to eastSouthmanager)
If you are running this example with HSQL, open SampleQDSecuredParameters.xml and change <ERESInstallDir> in the line
<URL>jdbc:hsqldb:<ERESInstallDir>\help\examples\DataSources\database\woodview</URL>
to your install directory. For example, if you installed ERES under c:\ERES the line between the <URL> tags would read jdbc:hsqldb:c:\ERES\help\examples\DataSources\database\woodview. Make sure that under Manage Data Sources in the Organizer, the URL for this database reads the same as the above.
To prepare a data view for our example, open the Organizer, click button on the toolbar, select Sample.xml data registry and click . Select Databases/Woodview/Data Views node and click . Choose CUSTOMERS table in the Choose Tables dialog, click to add it to the Selected Tables pane, and then click to close this dialog. You are in the Create Data View dialog now. Enter Customers name for the view, select the CUSTOMERS table on the left, click to add it to the View Fields pane, and click to close the dialog. The data view is prepared. Close Data Source Manager and the Organizer.
To create your own report, shut down and restart Tomcat, then sign in as one of the Manager logins just created (not the executive level). Open QuickDesigner and select create a new report/chart. Click and select Databases/Woodview/DataView/Customers data view. In the DataView Builder, select columns REGION, COMPANY, ADDRESS, CITY, STATE, ZIP and click . Do not add any conditions in the Set Conditions dialog and let all fields be visible. Click and . Save your report, making sure that all your users have access to the file and the database (see Section 2.3.2 - Setting User Privileges).
Log out and login again as
easternmanager:From the menu page, open the file you have just created.
You should see a sales report with all the Eastern values.
Log out and login again as
eastsouthmanager:Open the file you have just created from the menu page.
You should see a sales report with both the values for East and South.
Log out and login again as
exec:Click on the report you have created from Published Files.
You will only see one value, but if you click on the filter, you can change between the different security levels by typing in the region you would like to see.
When viewing this report from quick designer, you will be automatically prompted for the value you would like to see and prompted again every time you refresh, as you would be with any other parameter.
If you were to create a report using this query in quick designer while logged in as a user with GrantAll privileges (the Executive level in the example) the report would be saved by default without any secured parameters, and all users will be able to view all parameter values from the menu page, quick designer and report designer. Any security on a report created from a user with GrantAll privileges must be done from Report Designer with template security (see Section 3.10 - Template Security).
If you want to create your own XML file, please follow the DTD spec at <ERESInstallDir>/qDesigner/QuickDesignerSecuredParameters.dtd.
| Tip |
|---|---|
In case you think your query is not being filtered properly, you can add the flag |
If you have selected to build a report using database data, either by designing a query in the Query Builder, by writing an SQL statement, or by running a data view, you can modify the query directly from the Report Designer or the Chart Designer without having to go back to the Data Source Manager.
To modify a report or chart's query, select Modify Query from the Data menu in Report Designer or Chart Designer. If you have designed a query in the Query Builder, then the Query Builder interface will re-open allowing you to modify the query. If you have entered an SQL statement, a text box will open allowing you to modify the SQL. If you have used a data view, the data view conditions window will re-open allowing you to change the filters, or pick additional fields.
Once you have specified the changes, you will be given the option to modify the query in the data registry, save a new query in the data registry, or modify only the query in the template.
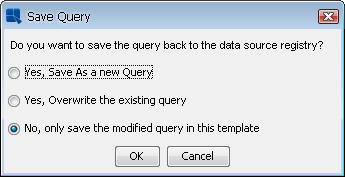
Saving Query Options
Once you have specified the save options, the modified query will be applied to the report or chart. Note that if you have made significant changes to the query you may have to again perform data mapping. For more on data mapping please see Section 3.2 - Report Types and Data Mapping for reports, and Section 3.13 - Chart Types and Data Mapping for charts.
If you have selected to build a report or chart using database data, you can also directly edit a template's database connection information from within the Report Designer or the Chart Designer. To modify the connection information in the report or chart, select Modify Database from the Data menu. This will bring up a dialog allowing you to specify a different URL, Driver, Username, and/or password for the report to use when connecting to the database.
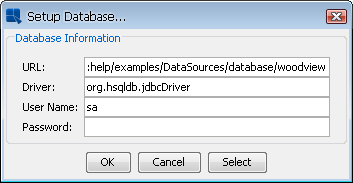
Change Database Connection Dialog
In addition to manually entering the database information, you can retrieve the database connection information from a data registry. To do this click the button on the Database Connection dialog. This will allow you to browse to the XML registry file from which you would like to pull the database connection. When you select a registry file, you will be presented with a list of databases defined in the registry.
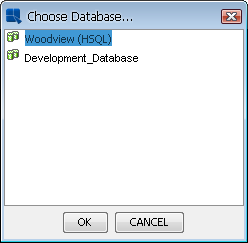
Select Database from Registry
Select the database that you would like to use, and click . The connection information for that database will be automatically applied to the connection dialog. After you have set the connection information for the template, click to apply the changes. A dialog will open asking you if you would like to verify the new connection information.
Verify Connection Dialog
Unless you know the data source isn't present, it's generally a good idea to check that the supplied connection information is correct. If you're changing the database connection information in a report, all the sub-reports, charts, and drill-down layers in the report that use the same connection information will be automatically updated as well.
Unlike the modify query feature, changes to a template's database connection are only saved in the template. They cannot be saved back to the data registry.
If you're having difficulty connecting to your database via JDBC, ERES provides a small utility that you can use to help troubleshoot the problem. To launch the utility point your Web browser to http://machinename:port/ERES/TestConnection.jsp. This page opens a small form that allows you to enter the database connection information, as well as a sample query.
The utility will directly contact the database (outside of any ERES components) and execute the query if one is provided. Any connection/query errors and suggested remedies will be printed on the page.
In addition to relational databases, ERES allows you to retrieve data and query XML files. XML data can be in virtually any format, but you need to specify a DTD file or an XML Schema (XSD) along with the XML data. To set up an XML data source select the XMLFiles node in the Data Source Manager and click . A dialog will open prompting you to specify options for the new XML source.
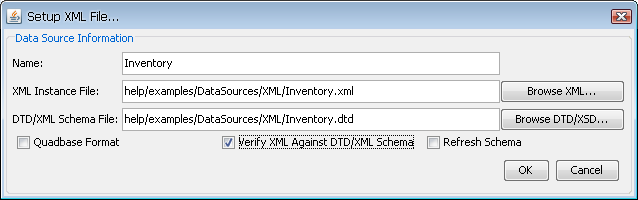
Setup XML Data Source Dialog
The first option allows you to specify a display name for the XML data source. The second option allows you to specify the location of the XML file from which you would like to retrieve data. Note that you can also specify an XBRL file in this field. You can set up a data source that retrieves XML data from an HTTP server here as well, by adding the appropriate URL as the file location. The third option allows you to specify the location of a valid DTD or XML schema file for the XML file.
The Quadbase Format checkbox allows you to indicate whether the XML file is in the form of an XML export from ERES. For example, if you choose to export a report's data in XML format, you can read it back in using this format. For more on exporting to XML, see Section 3.5.2 - Exporting Reports. When you use a file in this format you do not have to specify a DTD or XML Schema.
The Verify XML against DTD/XML Schema checkbox will make sure that the supplied XML file/source complies with the layout specified in the DTD or XML schema file. Because queries are designed based on the structure of the DTD/XML Schema file, a non-conforming XML source could produce unexpected results. If the XML does not conform to the DTD or XML schema you will be given a warning. You can, however, continue setting up the data source.
The Refresh Schema checkbox will only appear if you choose to edit an existing XML data source. Checking this option will reload the schema or DTD definition to incorporate any changes to the structure in the XML data source in the registry. This option is only necessary if the DTD or schema definition has changed since the data source was first created.
Once you have finished setting up the XML file and the DTD/XML Schema, a new dialog will open allowing you to specify the data type for all the selectable elements in the XML data source. The dialog will be different depending on whether you are using a DTD file or XML Schema.
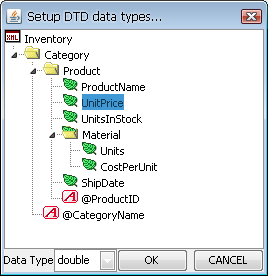
DTD Data Type Selection Dialog
Because DTD files do not specify a correct data type for elements, all elements are considered to be Strings by default. To change the data type of an element you have to select the element and pick a data type from the drop-down window at the bottom of the dialog. To ensure proper results when you query the XML file, you should set the data type for all selectable elements. This includes leaf nodes, parent nodes that contain data, and attribute elements. The following data types are supported:
String
Integer
Double
Date (If you specify date as the data type you will also be required to specify the date format.)
Boolean
Once you have finished specifying the data types, click and the XML source will be added to the Data Source Manager.
If you're using an XML schema a different data types dialog will open.
XML Schema Data Type Selection Dialog
Generally, the data types should already be defined in the XML schema file, but you can make any changes as necessary in this dialog. Once you have finished specifying the data types, click and the XML source will be added to the Data Source Manager.
Once you have set up an XML data source, you can then create queries to select nodes, specify filtering conditions, and transform the tree structure into the tabular form used by ERES. To add a query, select the node for your XML source, and click the button. This will launch the XML query builder interface that allows you to construct the query.
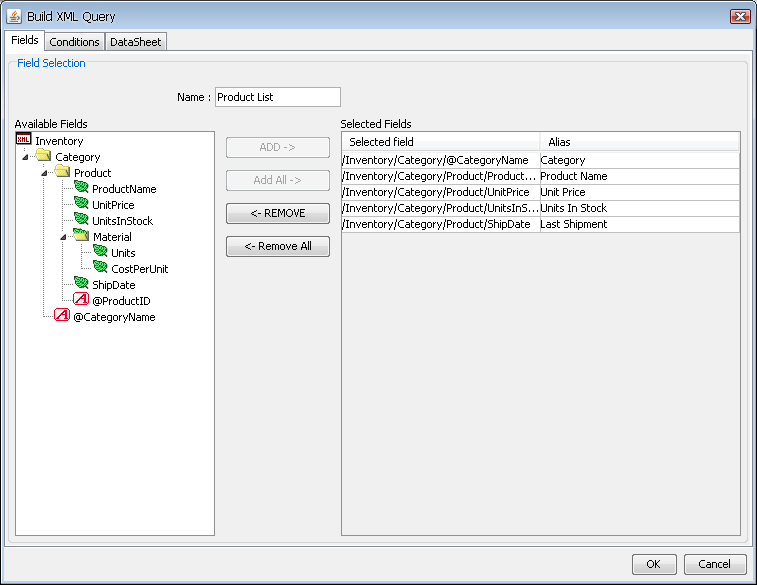
XML Query Field Selection Tab
The first tab in the XML query builder allows you to select the fields/nodes from the XML file that you would like to use in the report. The left-hand side of the window contains the tree structure from the DTD or XML schema file. You can pick any selectable elements and add them to the query, by clicking the button. Selected fields will appear in the right-hand side of the window. You can specify an alias for any field by double clicking the Alias field for a column, and typing the new column alias.
| Note |
|---|---|
Each selected element will become a column in the report or chart data. For results where a one-to-one relationship cannot be determined, the tabular structure is built using all available permutations in the data (similar to a cross-join in SQL). For best results it is recommended that you select fields for a query where a clear hierarchical relationship is present. |
The Conditions tab of the XML query builder allows you to specify some basic filtering criteria for your selection.
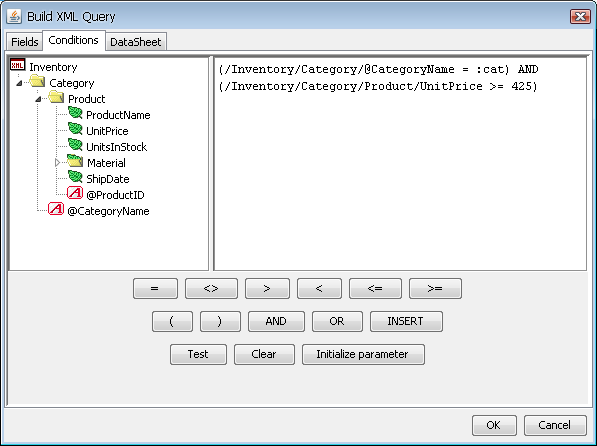
XML Query Conditions Tab
You can specify an equal, not equal, greater than, less than, less or equal to, or greater or equal to condition for any selectable element in the XML file. You can also use the AND and OR operators to build compound conditions. Fields are specified using a direct path down the XML tree. Currently only direct path is supported. You cannot use more complex XPath expressions. To add a field you can double click on it in the left-hand side, or you can select it and click the button.
After you have finished writing the conditions, click the button to verify that the syntax is correct.
The DataSheet tab allows you to preview the query result, and see how the XML data is converted to tabular form. You can navigate through the result set in the same manner as Query Builder (Section 2.4.3.2.1.5 - Adding Extra SQL).
Once you have selected fields, and specified the appropriate conditions, click the button. The query will then be added as a new node under your XML source in the Data Source Manager, and can now be used to create a report or chart.
There is a sample XML file with DTD and XML schema descriptions included in the ERES installation. The files are located in the help/examples/DataSources/XML directory of your installation and are called Inventory.xml, Inventory.dtd and Inventory_XSD.xml, Inventory.xsd for the XML schema example. There is also a sample servlet that allows you to stream XML data to the Chart Designer. The servlet code and instructions are located in the help/examples/DataSources/XML/servlet directory.
As with database queries, you can also specify parameters for XML queries. The same syntax “:” is used to denote a parameter in the XML condition as it is in a query condition. So the following XML condition:
/Inventory/Category/@CategoryName = :category
would place a dynamic filter on the query for the CategoryName attribute. XML parameters are initialized in the same manner as query parameters. The initialization dialog will appear if you try to preview or close the query, or you can trigger it by clicking the button. The only difference is that instead of mapping to a database field, the parameter prompt can be mapped to a node in the XML file.
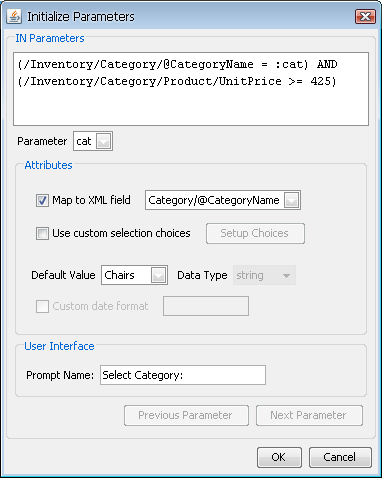
XML Parameter Initialization Dialog
ERES also allows you to retrieve data from flat text files. To add a text file as a data source, select the TXTFiles node in the Data Source Manager and click . A dialog will open prompting you to specify a display name, and the location of the text file that you would like to use.
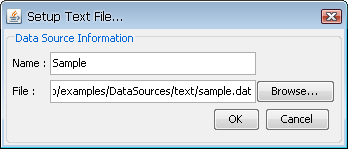
Add Text Data Source Dialog
| Tip |
|---|---|
The text file can be also retrieved from URL. To do so, enter the URL to the File text field. You have to enter a full URL with protocol etc. (for example: |
After you have specified the information, click and the text source will appear under the TXTFiles node of the Data Source Manager window.
There are certain formatting requirements for the data within a text file in order for it to be read by ERES. Generally, data is expected to be in a form similar to the following:
String,date,decimal
Name,day,Volume
"John","1997-10-3",32.3
"John","1997-4-3",20.2
"Mary","1997-9-3",10.2
"Mary","1997-10-04",18.6
The above data file is a plain text file. The first row specifies the data types and the second row specifies the field names. The third row and on are the records. Every text file must consist of these three parts. There are four records, with three fields each in the example data file. The delimiter between the fields may be one of the following characters: ",", ";", or " " (that is a comma, semi-colon, or space). Each field may be put in quotes (single or double).
In text data files, the data type is specified using a keyword. The following is a list of recognized keywords, and their corresponding JDBC type and Java type.
| Data File Keywords (Not Case Sensitive) | JDBC Type | Java Type in ERES |
|---|---|---|
| Boolean, logical, bit | BIT | Boolean |
| tinyint | TINYINT | byte |
| smallint, short | SMALLINT | short |
| int, integer | INTEGER | int |
| long, bigint | BIGINT | long |
| float | FLOAT | double |
| real | REAL | float |
| double | DOUBLE | double |
| numeric | NUMERIC | java.math.BigDecimal |
| decimal | DECIMAL | java.math.BigDecimal |
| date | DATE | java.sql.Date |
| time | TIME | java.sql.Time |
| timestamp | TIMESTAMP | java.sql.Timestamp |
| string | CHAR | String |
| varchar | VARCHAR | String |
| longvarchar | LONGVARCHAR | String |
For certain data types, the data in a text file must be presented in a specific format. The following is a list of the data types that require specific formatting.
| Data Type | Format | Example |
|---|---|---|
| Date | yyyy-mm-dd or yyyy-mm | 2001-06-12 or 2000-06 |
| Time | hh:mm:ss | 12:17:34 |
| Timestamp | yyyy-mm-dd hh:mm:ss | 2001-06-12 12:17:34 |
| Boolean | true/false, t/f, 1/0 (case insensitive) | true |
There is a sample text file included in the ERES installation. The file is located in the help/examples/DataSources/text directory of your installation and is called Sample.dat.
For maximum flexibility, ERES allows you to design reports and charts using object or array data, by providing an interface to pass data to the Report Designer as an argument. Using the API, you can implement IDataSource to return an IResultSet object similar to the java.sql.ResultSet interface used for JDBC result sets. Users can provide their own implementation of IResultSet, or use one provided by ERES.
For more information about this feature please see Appendix 7.A.5 - Data passed in a Custom Implementation.
To add a class file as a data source, select the ClassFiles node in the Data Source Manager, and click . A dialog will open prompting you to specify a display name, and the location of the class file that you would like to use.
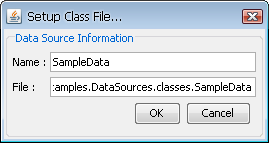
Add Class File Dialog
There is sample code available in the help/examples/DataSources/classes directory of the installation. The complied code will generate a class file that passes the data array into Report Designer or Chart Designer. Note that in order to use a class file as a data source, you must have the file or directory containing the package in the classpath of your application server/servlet runner.
Here is a simple guide to use SampleData.class file available as datasource in ERES Data Registry:
The most simple solution is to copy SampleData.class file from <ERES install dir>/help/examples/DataSources/classes into <ERES install dir>/WEB-INF/classes/help/examples/DataSources/classes directory (you will have to create help/examples/DataSources/classes under <ERES install dir>/WEB-INF/classes/ before copying the file).
| Note |
|---|---|
You can also change the app server |
Start or restart your Tomcat server and open ERES Organizer - DataRegistry
Select ClassFiles and add the new classfile by filling in the dialog (as showed in the picture above):
- Name:
SampleData
- File:
help.examples.DataSources.classes.SampleData
Now you can view your ClassFile data and use it as datasource for reports and charts.
ERES provides an additional API interface, IParameterizedDataSource, that allows you to define report/chart parameters within the context of a class file data source.
Parameters that are defined within the context of a class file work in the same manner as query parameters. For more information on setting up a parameterized class file data source, please see Appendix 7.A.5 - Data passed in a Custom Implementation.
Using Enterprise JavaBeans™ technology, developers can simplify the development of large enterprise applications. With EJB technologies, developers can rely on building business logic, and allow the application server (EJB container) to manage all the system level services.
When working in the Java EE™ environment, persistent data interfaces are provided by entity beans. Although the underlying storage mechanism may be a relational database, the application data model is the EJB, and it may not be desirable to have a reporting tool making redundant database connections. For this situation, ERES allows users to query data directly from an entity bean.
To add an EJB as a data source, the EJB must first be deployed in the application server, and the client JAR file containing the appropriate stub classes must be added to your application server/servlet runner's classpath. Select the EJBs node in the Data Source Manager and click . This will bring up a dialog allowing you to specify a display name, and the connection information for the bean.
Add EJB Dialog
To connect to an EJB data source, you must provide the JNDI lookup name for the bean (this is specified when you deploy the bean). For EJB 1.1 users, specify the name for the home interface and the remote interface. For EJB 2.0 users, specify the local home interface and the local interface. Once you have specified all the information, click the button, which will analyze the home interface, and retrieve all of the finder methods. Any methods found will be populated in the List of Methods section in the dialog.
The same dialog can be used to filter the data being retrieved based on parameters that are present in the finder methods. When you select a method in the left-hand dialog, any parameters present will appear in the Parameter List section. You can then click on a parameter to set its value.
Specifying EJB Parameter Values Dialog
When you select a parameter, the data type of the parameter will appear in the lower portion of the window. Below that you will be able to specify a value for the parameter. Be sure to enter a correct value for the data type, and then click the button. This will fix the parameter values. Once you have finished setting all of the parameter values, click the button. This will bring up a new dialog allowing you to specify the environment properties for your application server. This information is necessary for the ERES Server to connect to the EJB.
EJB Environment Setup
The fields here are the available environment properties for the JNDI context interface. You don't have to specify values for all of them, only the information necessary for your environment (application server). Once you have finished specifying the environment variables, click . You will be returned to the EJB setup window. Click again to finish setting up the EJB data source. A new node will appear under EJBs with your EJB.
You can modify the parameter values by selecting your EJB source, and clicking the button.
There is a sample EJB data source included in the installation in the help/examples/DataSources/EJB directory. Contained in the directory are the sales.ear, and the salesClient.jar files, as well as the source code for the Sales entity bean. The sales.ear file is designed to be deployed in the Java 2 Reference Implementation, and uses the Cloudscape database as the underlying storage mechanism. You can use the SalesClient.java program to populate the Cloudscape database. The salesClient.jar file contains the stub classes to connect to the deployed Sales EJB, and needs to be in the classpath.
ERES also allows you to retrieve data using SOAP (Service Oriented Architecture Protocol). To connect to a SOAP data source using WSDL, you don't have to know URLs for the services, SOAP actions, operation names and parameters. All you have to know is a location of WSDL file, which contains all the necessary information.
To set up a SOAP data source, select the SOAPServices node in the Data Source Manager and click . A dialog will open prompting you to specify options for the new SOAP data source.
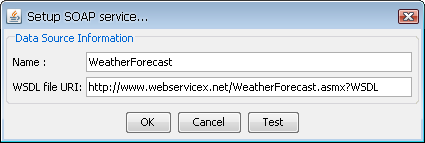
SOAP data source setup
The first option allows you to specify a display name for the data source. The second option allows you to specify a location of the WSDL file. The location can be either absolute path on the server or path relative to your ERES installation directory or URL. Once you've specified the connection information, you can test the connection to the WSDL file by clicking the button. This will test retrieving the WSDL file from the URI you've provided, check the file for any supported SOAP operations and report any problems. After clicking , a new SOAP data source node will be added to the data registry.
To add a new SOAP View select an existing SOAP data source and click the button. A dialog will open prompting you for all the parameters necessary to make a SOAP query.
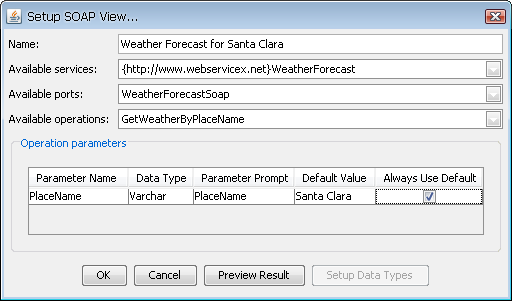
Setup SOAP View dialog
The first option in the dialog allows you to specify a display name in the Data Source Manager. Next there is three drop-down menus in the dialog. The first drop-down menu contains all the SOAP services described in the WSDL file. Once you have specified a service, the second drop-down list will be populated with all the ports of this service. Selecting a port will populate the last drop-down list with all the operations of this port. If you move the mouse over any drop-down list, a hint will appear with documentation for the service/port/operation (if the documentation is provided in the WSDL file). After specifying the service, port and operation, all the parameters of the operation will be read. If there are some parameters, they will be displayed in a table. The first two columns of the table are not editable. They are read from the WSDL file. The next 2 columns are editable and allow you to specify parameter prompts and default values. The last column contains a checkbox which allows you to choose whether the default parameter value will always be used or not. This means that this parameter value will be fixed and you will not be prompted for it. All the parameters that don’t have this checkbox checked will be used as report/chart parameters.
The button is only available when editing the SOAP View from the Data Source Manager and allows you to adjust data types when necessary. In order to verify result from the SOAP response, click the button. All the default values will then be tested to see if they have proper data type or not. In case they do not match, you will be prompted to adjust them. After that you will get the setup data types dialog (the same as for XML data source). If the data source is parameterized, you will get the parameter prompt dialog before specifying data types. Please note that in order to generate the XML schema properly, you have to specify existing parameter values.
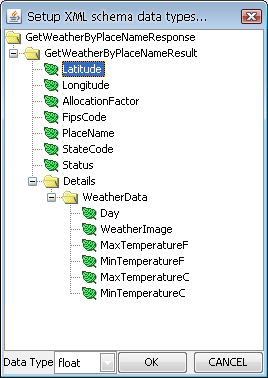
Setup XML Schema Data Types dialog
From this dialog you can setup data types. The behavior is exactly the same as for XML data source with DTD schema (see Section 2.4.4 - Data from XML and XBRL Files). Once you have finished specifying data types, click . A dialog will then open showing you the result preview.
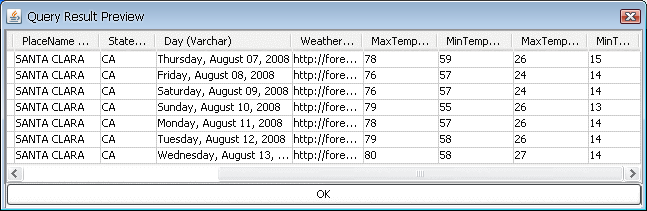
Query Result Preview dialog
Clicking in this dialog will take you back to the Setup SOAP View dialog. Once you have finished specifying all the necessary information, click the button in the dialog. A new node will then be added under your SOAP data source in the Data Source Manager, and can now be used to create a report or chart.
There are several examples of the Web Services from http://www.webservicex.net/ that you can try:
- USA Weather Forecast:
This web service obtains weather forecast for valid zip code or place name in USA. The WSDL file location to use is:
http://www.webservicex.net/WeatherForecast.asmx?wsdl.- US Address Verification:
The service simply verifies given US address. The WSDL file location is:
http://www.webservicex.net/usaddressverification.asmx?wsdl.- Currency Convertor:
This web service gets conversion rate from one currency to another currency. The WSDL file location is:
http://www.webservicex.net/CurrencyConvertor.asmx?wsdl.
The Salesforce data source is designed for existing Salesforce users who want to display their Salesforce data in ERES. The connection to the Salesforce server is established via SOAP using Salesforce Partner WSDL (version 13.0). Users communicate with Salesforce server by SOQL (Salesforce Object Query Language) queries. Please note that users have to have valid Salesforce accounts with username and password to work with this data source. Moreover, users who use the ERES Salesforce data source have to have access to Salesforce account from trusted networks. To add your IP address to the trusted IP list, you have to activate your computer as described below.
For more information, about SOQL queries and activating Salesforce user's accounts from trusted networks, please visit the following Salesforce sites:
SOQL queries
http://www.salesforce.com/us/developer/docs/api/Content/sforce_api_calls_soql.htm
Activating Salesforce user's accounts
http://na5.salesforce.com/help/doc/en/security_networkaccess.htm
To set up a Salesforce data source, select the SalesForce node in the Data Source Manager, and click the button. A dialog will open prompting you to specify a display name for the data source, user name and password to your Salesforce account. Once you've specified the connection information, you can test the connection to your Salesforce account by clicking the button. This will test the connection using the information you've provided, and report any problems.
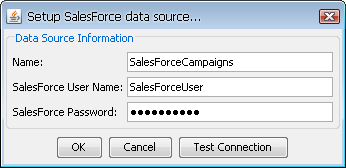
Setup SalesForce Data Source Dialog
Once you have added a Salesforce data source, a new node will appear in the Data Source Manager window. To add a new Salesforce query, click the button. A new dialog will open prompting you to specify a query name and SOQL query.
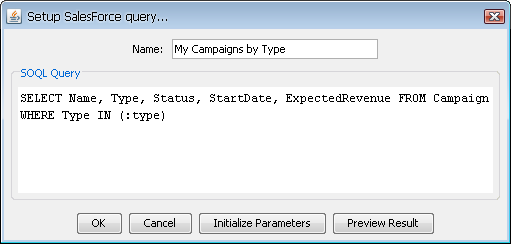
Setup SalesForce Query Dialog
Please note, that only child-to-parent relationship queries are supported in the current ERES version. So you cannot use parent-to-child queries (using nested SOQL queries). For more information about Salesforce relationship queries and their syntaxes, please visit the following Salesforce site: http://www.salesforce.com/us/developer/docs/api/Content/sforce_api_calls_soql_relationships.htm
Moreover, this dialog allows you to initialize query parameters in case that your query contains single value or multi value parameters. A parameter is specified within an SOQL statement by the ":" character. Generally the parameter is placed in the WHERE clause of an SOQL Select statement. For example, the following SOQL statement
Select Name, Type, Status, ActualCost From Campaign Where Name = :CampaignName
specifies a single value parameter called CampaignName. You would then be able to enter a campaign name at run-time, and only retrieve data for that campaign.
Another example of SOQL statement shows using of multi value parameters that take an array of values as the input rather than single values.
Select Name, Description, Type, LeadSource, Probability From Opportunity Where Type IN (:OpportunityType) And LeadSource IN (:OppLeadSource)
The statement specifies two multi value parameters called OpportunityType and OppLeadSource. You would then be able to specify opportunity types and lead sources at run-time, and you will only retrieve data according to specified parameters values.
In order to initialize SOQL query parameters click the button. The initialize parameters dialog will then appear allowing you to specify parameters mapping.
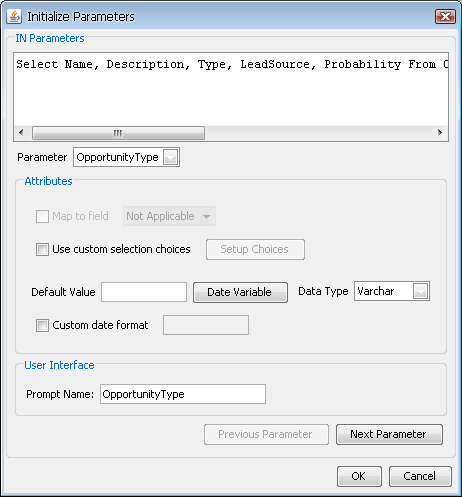
Initialize Parameters Dialog
From this dialog you can specify the following options:
- Map to field:
This allows you to specify a field from the Salesforce data source whose values will be used for the parameter input. Selecting this option modifies the parameter prompt that you will get when previewing or running the report/chart. If you map the parameter to a Salesforce field, then you will be prompted with a drop-down list of distinct values from which to select a parameter value. If you do not map, you will have to type in the specific parameter value.
- Use custom selection choices:
Rather then having a drop-down menu with all the distinct column values, you can build a custom list of parameter values for the end user to select from as well. To set up the list, select this option and click the button. This will launch a new dialog allowing you to create a list of choices.
The rest of options are basically the same as for database query parameters. For further information about initializing database query parameters, see Section 2.4.3.2.2.2 - Initializing Query Parameters. Once you have specified mapping for all available parameters, click the button and you will be taken back to the Setup Salesforce Query dialog.
From the Setup SalesForce Query dialog you can also preview the query result using the button to verify output from your query. In case, you have a parameterized query, the parameter prompt dialog will appear prompting you to specify parameter values. Once you have specified the parameter values, click the button and the query result preview dialog will appear.
Parameter Prompt
Query Result Preview Dialog
From this dialog you can verify the query output. Clicking the button will take you back to the Setup SalesForce Query Dialog.
Once you have specified the query, click the button. The query will then be added as a new node under your Salesforce data source in the Data Source Manager, and can now be used to create a report or chart.
ERES also allows you to design reports and charts using data retrieved from Excel files. To add an Excel file as a data source, select the ExcelFiles node in the Data Source Manager, and click . A dialog will open, prompting you to specify the data source name and to select the Excel file from which the data should be imported.
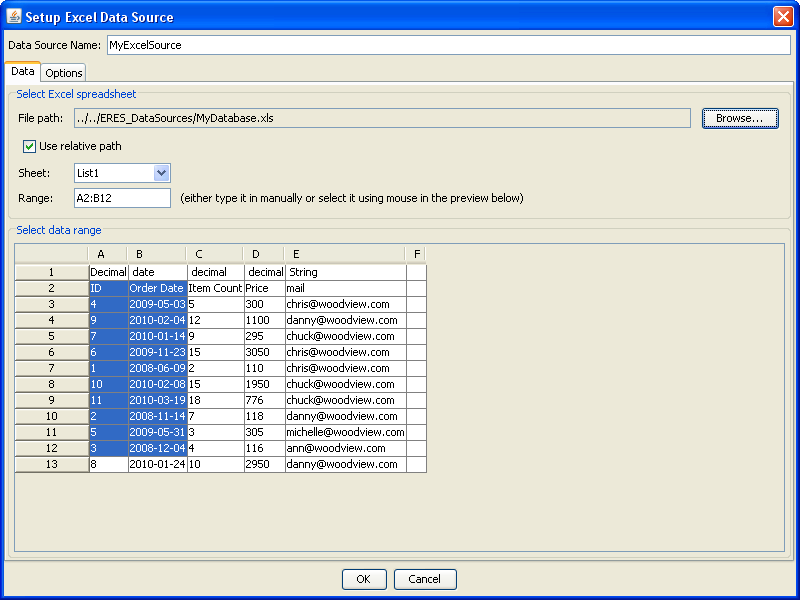
Setup Excel Data Source dialog - Data
After selecting the Excel file, the imported data will be previewed in the dialog. If the checkbox Use Relative Path is checked, the file path to the selected Excel file will be set as relative to the ERES installation directory. Otherwise the full path will be used. In case the Excel file is stored on a different disk drive from the one which ERES is installed on, this option is not available. You can select the sheet (if there is more than one in the file) and the cells which are relevant for the data source being designed using your mouse or by specifying the range in the Range box (for instance, you can specify that your source will use the data from the columns A and B, and from the rows 2 to 12 by typing A2:B12 in the Range box; this is the format which is also used for ranges in MS Excel). You can also select the data by clicking the row header or the column header. Hold Ctrl or Shift to select more rows or columns. Click the top left corner to select all the cells. Again, this behavior is similar to MS Excel.
Please, note that ERES can process both *.xls files and *.xlsx files. The *.xlsx files are used in Microsoft Excel 2007/2010 and they are based on Open XML.
ERES can also process basic Excel formulas. If it is not able to process the formula that you have entered, an error message will be displayed.
Empty rows (in case the data are in columns) or columns (in case the data are in rows) at the end of the sheet are automatically removed from the data source, even in case they have been selected.
Click on the Options tab to specify whether the data are in columns or in rows to get the data structure correctly. You can also specify whether table headers are included in your data selection. The option Include additional rows (when you specify the data are in columns), or Include additional columns (when you specify the data are in rows) respectively, allows you include automatically the data rows or columns which will be added into the Excel file later, after the data source has been created, without needing to change the data source in the Data Source Manager manually.
The bottom part of the dialog on the Options tab shows you the data source content following the current configuration. You can change the data type for each column of the data source there, if desired. The data types are detected automatically, therefore changing the type should not be necessary in most cases.
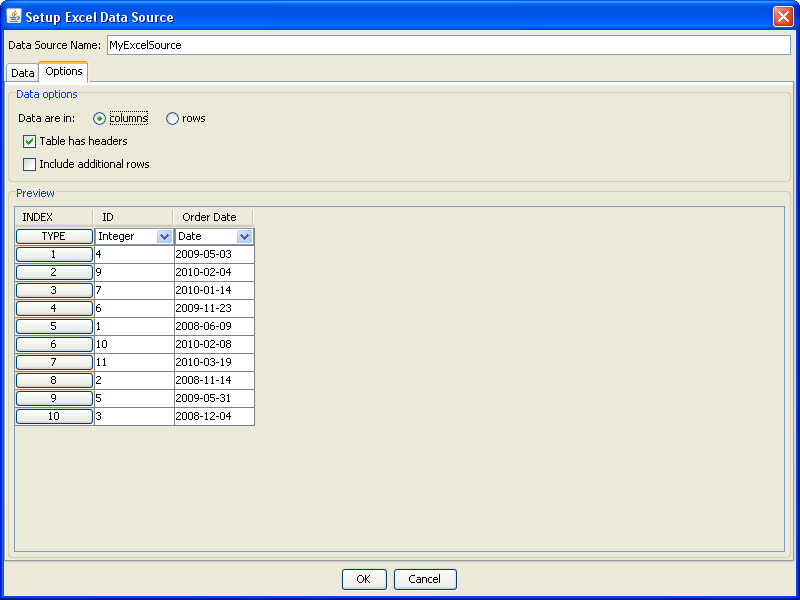
Setup Excel Data Source dialog - Options
Click to save the data source when the configuration is finished.
Once you have set up a data registry, the sources defined in the registry can be used for charts and reports. The first time you select to start a new report or chart you will be prompted to select the registry that you would like to use. If there aren’t currently any available registries (meaning that you haven’t created any, or you don’t have privileges to view any), you will be prompted to go the data registry manager to create one.
Once you have selected a registry, a data source manager window will open allowing you to select, add, or modify a data source that you would like to use for the chart or report.
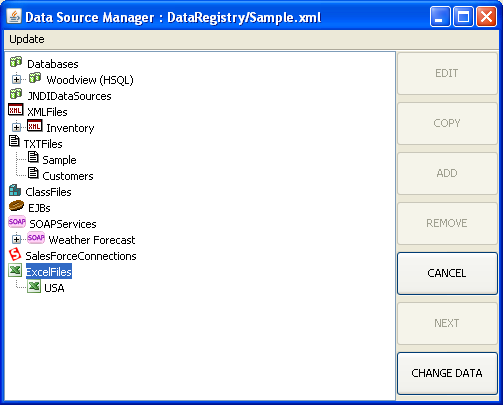
Data Source Manager Window for Chart Designer
After you first select a registry, then the next time you design a report or chart, it will automatically connect to that registry, and open the data source manager. You can change registries, by clicking on the button.
Once you select the data source which you would like to use for a report or chart, and click , the next screen will present the first twenty records from the data source (With the exception of data views, which will require you to select fields and set conditions first). From this screen you can see all of the records returned by the selected source, by checking the Show All Records box.
ERES allows you to construct reports and charts from multiple data sources. Once you have selected your first source, and click from the data table window, you will be presented with a dialog asking if you would like to process the current data, or select another data source.
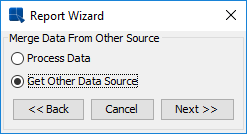
Additional Data Source Dialog
If you select Process Data and click , you will continue on to the next step in the report or chart wizard. If you select Get Other Data Source, you will return to the Data Source Manager to select another data source for the report. You can repeat this process to select as many sources as you would like.
Multiple data sources are combined sideways in the data table. This means that the columns from the second (or third, fourth, etc.) data source are placed to the right of the columns from the first data source. If the columns from one data source have more rows than another, then null values will be placed in the extra rows.
For example, assume you want to use two data sources to create a report. The data table generated by the first source looks like this:
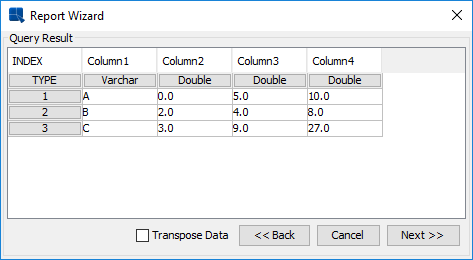
Data From the First Data Source
The data from the second source looks like this:
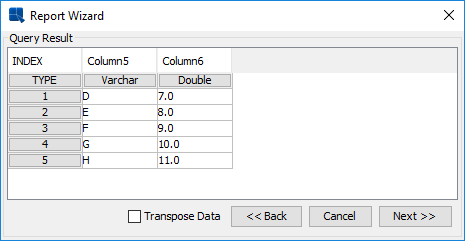
Data From the Second Data Source
When you combine the two data sources you will get the following data table:
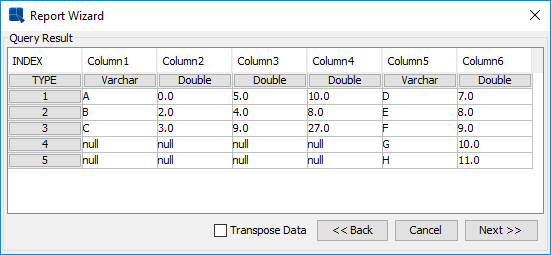
Data From the Combined Sources
As you can see, the two data sources have been placed side by side. Since the second source has more rows of data than the first, additional rows of null data have been added.
| Note |
|---|---|
You cannot use parameterized data sources to create a multiple data source. |
You can also use multiple data sources in reports by adding sub-reports. For more information about sub-reports, please see Section 3.9 - Sub-Reports
At any point during report or chart design, you can select to change the template’s data source. Since report and chart templates are saved with their data source information, you must use the option within Report Designer or Chart Designer to change the template's data source. Simply altering a data source in the registry will not effect the template unless you use the data source updating feature (for more on this, see Section 2.4.11 - Using Data for Charts and Reports). To change a template’s data source, select Change Data Source from the Data menu, or click the button on the toolbar. This will bring up the Data Source Manager, allowing you to select a new data source, or modify an existing one.
If the new data source is significantly different from the previous data source in numbers of columns or data types, you may have to re-map the data to the report or chart. This is necessary because any layouts or computations can no-longer work correctly with major changes to the structure of the data. For more about data mapping please see Section 3.2 - Report Types and Data Mapping for reports, and Section 3.13 - Chart Types and Data Mapping for charts.
There are many circumstances where you will want to move a group of templates, or a complete installation of ERES from one location to another. For example an application may move from a development to a test to a production environment. In each environment the location and connection information for data sources may change. In this scenario, updating report templates one-by-one as detailed in the previous section isn't a feasible way to change the connection information for a large number of templates. Instead, ERES allows you to quickly update a group of templates based on information in the data registry.
Although report and chart templates maintain an internal copy of the data source information (allowing them to be deployed independently) they also maintain information (location & source) about the data registry from which they were created. Hence, when you modify a report or chart's query (as detailed in Section 2.4.3.4 - Editing Queries) you have the option to save the changes back to the data registry. In order to use this feature, you will have to keep your data registry up to date. This means that query changes should be saved back to the registry, and changes in data view structure should be propagated to data view queries.
To use this feature, first make any modifications to the data registry that you would like to propagate to the templates. These modifications can include database connection information, file locations for text, XML data files, and even changes to data views or queries that you would like to pass to the templates.
Note that if you're moving reports or charts between installations, the data registry file will need to be moved to the same relative location in the new installation. In addition the associated query files for that registry (.qry/.dvw/.ddt) will need to be moved to the /queries/ directory of the new installation. (Query file names begin with the name of the registry).
From the data source manager, select Reports or Charts from the Update menu depending on whether you want to update charts. This will bring up a dialog allowing you to select which files you would like to update.
Select Reports for Data Source Updating
To select files to update, first browse to the directory that contains the reports/charts. After you select a directory, any report/chart templates will appear in the left-hand side of the dialog You can select any templates that you would like to update, and click the button. You can navigate to as many different directories as you would like to select templates. Selecting the Connection Info Only option will update only the connection information (database URL, driver, username, password, and locations for XML files, text files and Java classes). Queries and data view information will not be updated in the templates.
Once you have finished selecting the templates you would like to update, click and the updating process will begin. A dialog shows the progress showing which templates are updated and catching any errors.
Updating Data Sources Progress/Log Dialog
A log file named UpdateDataSources will also be written in the root directory of the installation with the contents of the progress screen. Reports that fail the updating for various reasons, can be updated manually using the option in Report Designer or Chart Designer.
| Note |
|---|---|
Only reports or charts for the current data registry will be modified. If you select templates that do not retrieve their data from a source in the current registry they will be ignored. |