Alerts are specified in a displayable object, namely, map, chart and report.
For Google Maps, currently there is no feature that can support alerts. So alerts are not supported in Google Maps in this version.
For SVG Maps, alerts can be specified on all thresholds in the map. You can select ranges that are critical for you. If any of the areas on the map would be in that range, alert will trigger.
If the map doesn't have any thresholds, alerts will not be available for the map.
Example:

SVG map with thresholds
You can for example say that ranges <= $90000 and $90000 - $330000 are critical and you will get alert if there are any yellow or light green areas in the map.
For Charts, you can specify alerts on control areas. Similarly to SVG maps, you can choose the ranges that are critical for you. If there are no control ranges, alerts will not be available for the chart.
Example:
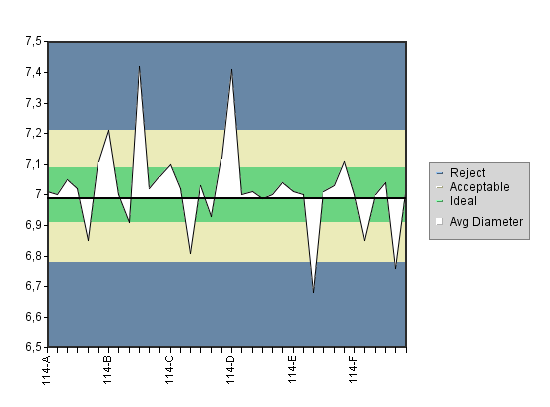
Chart with control areas
You can say that the Reject control area is critical and you will get alert whenever there is at least one data point in this (blue) control area.
Control area ranges are evaluated as left-closed, right-open intervals [start, end). In other words, the alert will trigger if the following condition is true: start <= ActualValue < end.
For reports, you can specify alerts in scripts. There is a special Formatting action called ALERT. You can assign any two strings to this action. First string will indicate name of the alert that should be triggered. Second string represents alert details. Alert details can be any sentence explaining the meaning of the alert or a convenient function result (for example: getAllRowData() - explained in Section 3.6.2.8.2 - String Functions). Several scripts can trigger single alert, or you can specify several different alerts in one report. For more information about scripting visit Section 3.7.1 - Creating a Script.
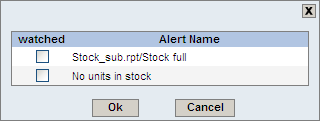
In the alert UI, you will get names of all possible alerts that can be triggered in the report and you can choose which ones you want to watch.
Example:
There are these two scripts in a report:
if ({Profit} < 0){
 FONTCOLOR = [255, 0, 0];
 ALERT = ["Negative Profit",getAllRowData()];
} else {
 FONTCOLOR = [0, 255, 0];
}

and

if ({AccountBalance} < 0){
 FONTCOLOR = [255, 0, 0];
 ALERT = ["Negative Account Balance","You're in debt!"];
}
If there is any row where AccountBalance is negative, the alert called Negative Account Balance will trigger. If there is any row where Profit is negative, the alert called Negative Profit will trigger. If both conditions are satisfied at once, both alerts will trigger.
The named alerts are analogical to ranges in maps and control areas in chart. They also have a name and you can select which ones you want to watch (you do not have to watch all of them). How to watch an alert will be described later.
Alerts can also be added to QuickDesigner reports. The interface and usage is similar to other quick designer dialogs making it easy to learn for quick designer users. However, it is also not as powerful as the alerts in the full report designer. Please see Section 3.20.2.4 - Alerts for Report Elements for details.
Subreports support alerts as well. The alert names are propagated to the main report. The alert names are prepended with subreport name to keep them unique in the main report (main report can have alerts with the same names and we don’t want to mix them).
Alert in subreport