Data mapping is the way that raw data is rendered in the chart. Although data can be drawn from many sources, a chart looks for the basic structure of the data to be in the form of a table. Hence, data passed in as arguments, from the report or from XML files is converted to a table structure before mapping.
Chapter 4 - Working with Data Sources explains how to retrieve data from various sources.
A basic set of data might look something like this:
| Product | Sales |
|---|---|
| Chair | 362 |
| Table | 862 |
| Dresser | 1052 |
| Cabinet | 1211 |
To plot this data in a chart, you would want to plot the Sales value for each entry in the Product column. Hence, the products are your category and the sales numbers are your values. In a chart you would map the Product column to the X (category) axis and the Sales column to the Y (value) axis. The resulting plot would look like this in a column chart:
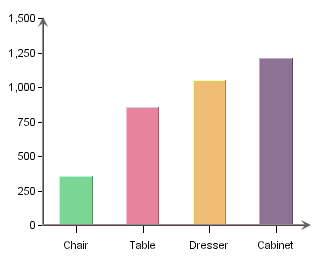
Here, a column is drawn to show the value for each distinct element in the category column. On top of the basic category values, additional information can be displayed in the form of a data series. For example, say that there is another element to our data that shows sales data not only for product, but also over a sales region. Our adjusted table would look like this:
| Product | Region | Sales |
|---|---|---|
| Chair | East | 114 |
| Chair | Midwest | 131 |
| Chair | West | 117 |
| Table | East | 231 |
| Table | Midwest | 187 |
| Table | West | 444 |
| Dresser | East | 327 |
| Dresser | Midwest | 469 |
| Dresser | West | 256 |
| Cabinet | East | 422 |
| Cabinet | Midwest | 386 |
| Cabinet | West | 403 |
In order to show the value for each region per product we could add the Region column to the data mapping as a data series. Doing this gives us the following chart:
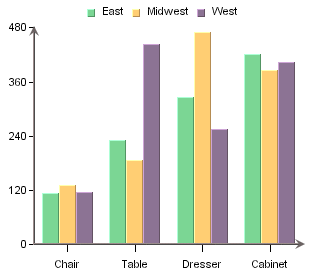
Now each category has three data points, one for each region. For two-dimensional charts the series is always displayed in-line. In three-dimensional charts, the series is drawn on the Z-axis by default, although it can be drawn in-line as well. Below, is the same chart show in 3D.
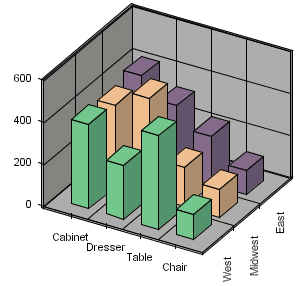
In this chart, the data series is drawn along the Z-axis. Note that the order of the categories has been changed to provide a better view of the data. This is the basic concept behind data mapping. Most chart types use this mapping technique or mapping options similar to this. Detailed data mapping instructions for each chart type are available in Chapter 5 - Chart Types and Data Mapping.