Box Chart
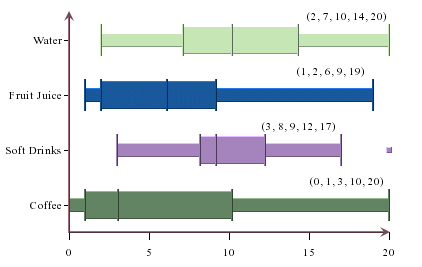
EspressChart provides a statistical chart type, the Box Chart, also known as Box and Whiskers Chart. Basically, the box chart provides a quick visual realization of summary statistics. A histogram shows the distributions of observed values so you can identify the peak(s), minimum, maximum values and clustering of data. A box chart, on the other hand, displays a summary of data distribution in quarterly percentiles (Minimum data point, 25th percentile, median, 75th percentile, and Maximum data point).
The middle line in the box represents the median. The other lines in each direction represent the 25th percentile increment (decrement). The minimum and maximum points are the observed minimum and maximum which are not outliers. The lines that extend from the edge of the box to the minimum/maximum are sometimes called whiskers. Hence, the name box and whisker chart. Outliers are any values that are 1.5 times (or more) the length of the box, that being the difference between the 75th and 25th percentiles. Outliers are calculated and shown as dots away from the box. The other nice feature about box plot is that you can stack up the boxes in one chart to compare summaries of different data sets.
EspressChart allows box charts to be displayed vertically in addition to the default horizontal setting. To use this feature in Chart Designer, create a box chart and then select → , and select Vertical.
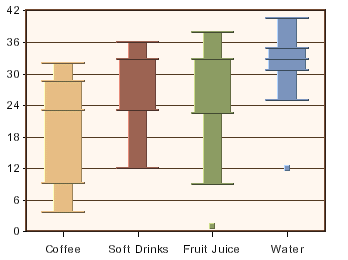
Vertical Box Chart
This chart is available in two-dimensional form only.
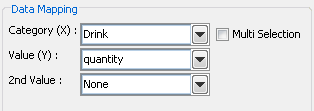
Mapping Options for Box Charts
For box charts the mapping is as follows:
Category (X): | Allows you to choose a data column whose distinct values determine the various categories. |
Value (Y): | Allows you to choose a data column to provide values for each category. These values are used to calculate the minimum data point, the 25th percentile, the median, the 75th percentile, and the maximum data point. |
2nd value: | Add a second value to create a combination chart. |
Please note that the 2nd Series and Combo options are not available for box charts. This is because the only combination available with box charts is a line.
The data mapping also allows you to transpose the data (in other words: to select several columns for a single category). To learn more about data transposition, please see Section 5.1.1 - Data Transposition.