Bubble Chart
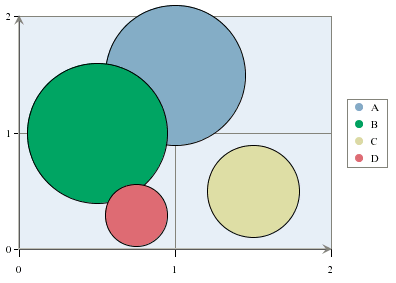
A bubble chart is used to represent data wherein the size of the bubble also provides information. A data point is represented by an XY coordinate and a third point, which is the radius of a circle or bubble.
This chart is available in a two-dimensional form only. For more information about the bubble charts and their display options, please see Section 6.9.1 - Bubble Charts.
The data mapping for bubble charts is similar to three-dimensional scatter charts; however, instead of plotting a Z-axis position, the third value determines the size of the bubble (specifically the radius).
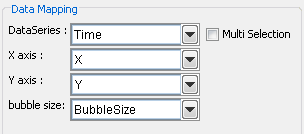
Mapping Options for Bubble Charts
Note that similarly to a scatter chart, the columns have to be numeric in order to be mapped successfully.