The viewport compromises the central portion of the Chart Designer window. Within the viewport you can select, move, and size all of the various chart elements on the canvas.
The chart canvas is the background on which all of the chart elements are drawn. Its dimensions are the size of the finished chart. You can modify the size of the chart canvas by selection → . This will bring up a dialog prompting you to specify the new canvas dimensions.
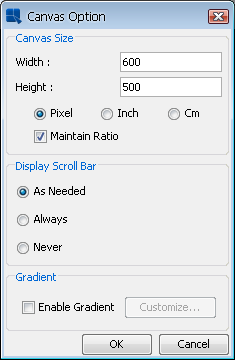
Canvas Formatting Dialog
You can specify the canvas size in pixels, inches, or centimeters. From this dialog you can also specify when to use scroll bars in the viewport. By default the viewport will display scroll bars when the canvas is larger than the window. When the canvas is smaller than the viewport window, a dark gray area will appear around it.
On this dialog, you can also set up gradient background for the canvas. The gradient settings are the same as in the Rendering options described in the Section 6.1.3 - Format Menu.
You can add an image as the background of the chart instead of having a plain or a colored canvas.
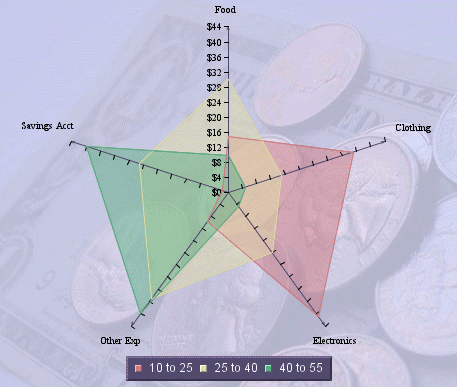
Radar Chart with Background Image
You can add a background image by selecting → or by clicking the ![]() button on the toolbar. This will bring up a dialog allowing you to specify the background image for the chart.
button on the toolbar. This will bring up a dialog allowing you to specify the background image for the chart.
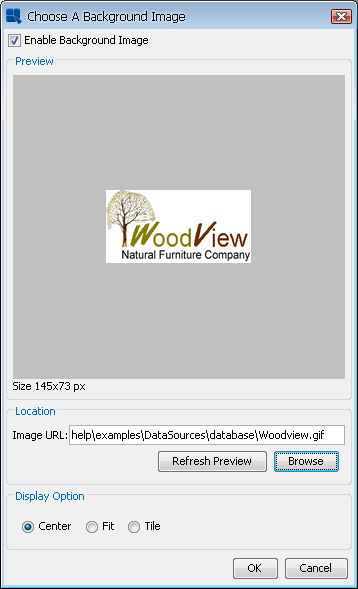
Add Background Image Dialog
To insert a new image, select the Enable Background Image option. If you want to remove an existing background image and use simple background color instead, unselect this option.
There are two ways of inserting background images: either locate the image on the hard drive or retrieve it from an URL.
To locate an image on the hard drive, click on the button.
To retrieve image from an URL, enter the URL in the Image URL text field. After that, click on the button to verify the URL. If the image from the URL appears in the Preview section, the URL is correct.
If you add a background image and save the chart as TPL or CHT, the image itself is not stored with the chart. Only the path or URL is saved. If you move a TPL or CHT chart, you need to be sure that it can still access the image along the path specified. If you save the chart as PAC, the background image will be stored in the PAC file along with the chart.
You can select any element in the chart by clicking on it. The status bar at the bottom of the Chart Designer window will indicate which object has been currently selected. Clicking and dragging on an object will move it around the chart canvas. Note that some objects like axis or data top labels move in tandem, while other objects like legends move independently.
You can move the entire chart plot by clicking in the plot area and dragging the mouse. This will move the entire chart around the canvas. To resize a chart right click and drag within the plot area. This will cause the plot to enlarge or shrink. You can also size three-dimensional charts by using the zoom control in the navigation panel.