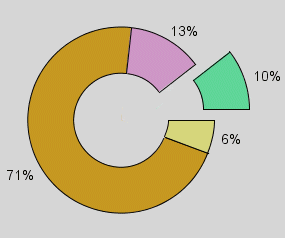
Doughnut Chart
A doughnut chart is the same as a pie chart, except for the “hole” in the center.
Just as for a pie chart, if a data series is selected, a separate doughnut will be drawn for each category element and each doughnut will be comprised of the series elements. When a series is present, all the separate doughnuts are drawn on a single plot area and resized in proportion with the plot. You have an option to either stack the different doughnuts or draw them in a line.
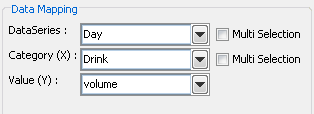
Mapping Options for Doughnut Charts
Data mapping for doughnut charts is exactly the same as for pie charts (discussed in section Section 5.8.1 - Data Mapping).