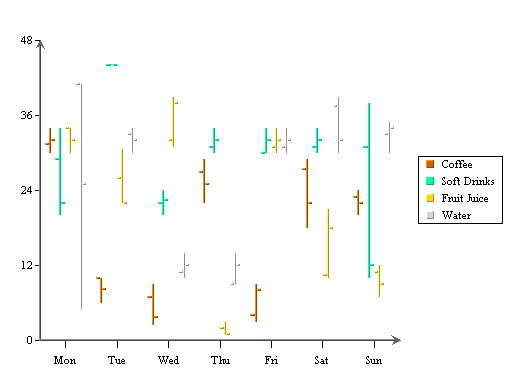
HLCO Chart
A HLCO (High Low Close Open) chart is similar to the high-low chart described above, except that it also contains an open column. It is useful in presenting data that fluctuates over discrete periods of time, such as stock prices or inter-day temperatures. The HLCO chart can also be displayed in a Candlestick format for both 2D and 3D charts. This feature is described in Chapter 6 - The Designer Interface.
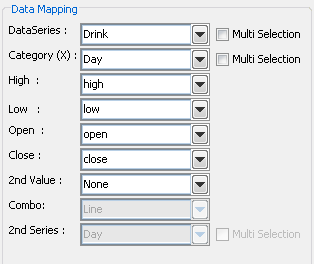
Mapping Options for HLCO Charts
Data mapping for HLCO charts is similar to that for High-Low charts. The only difference is that instead of specifying two different value columns, you must specify four different columns - High, Low, Open and Close. Combo options are Line, Column and Overlay.
A common kind of chart is a one that plots both stock price and trading volume in the same chart. This can be accomplished using an HLCO-column combination in EspressChart.
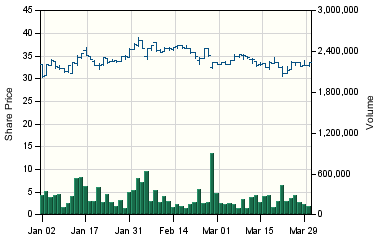
HLCO-Column Combination Chart
This example plots stock price and volume data over a three month period.