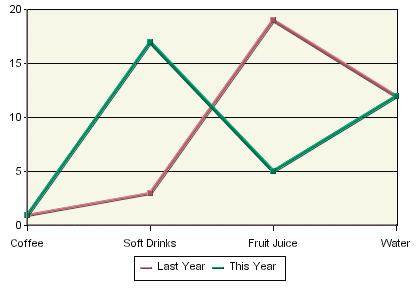
Line Chart
Line charts present data in a manner similar to column charts. For a two-dimensional line chart, a marker denotes a data point for each category. The value column, which must be numeric, determines the height of a marker. Each marker is joined with a line. If the chart has a data series, a separate line is drawn for each element in the series. Please note, the markers (points) are not shown by default. You can enable showing markers (points) in the Line and Point dialog. This dialog can be opened from the Format menu or by clicking the ![]() icon on the toolbar.
icon on the toolbar.
EspressChart allows 2D line charts to be displayed vertically in addition to the default horizontal setting. To use this feature in Chart Designer, create a line chart and then select → . Next, select Vertical. The chart is rotated clockwise 90 degrees.
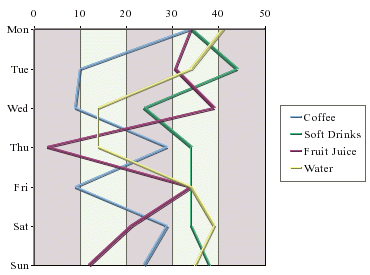
Vertical Line Chart
A three-dimensional line chart is an extension of its two-dimensional counterpart. It contains no additional information. The markers disappear (they are not available for 3D line charts) and thicker lines, spaced apart on the Z-axis, replace the thin lines.
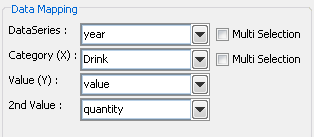
Mapping Options for Line Charts
Data mapping for line charts is almost exactly the same as for column charts (discussed in Section 5.2.1 - Data Mapping). Line charts, however, do not have the 2nd Series and Combo options. This is because the only combination available with line charts is a line. To create line combinations with other chart types (bar, column, stack column, etc) select the other chart type as the primary chart, and select Line as the Combo option.