After you finish designing a chart, you can save the definition as a chart or as a chart template, and provide XML definitions for both. You can also generate a number of static image exports of the chart or create a JSP/JNLP page with the Chart Viewer JNLP (More about Applets in JNLP: Section 2.6 - Run Applets in WebStart with JNLP file).
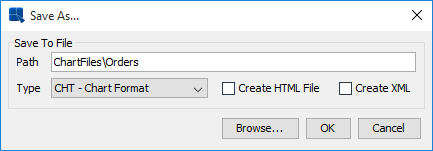
To save the current chart, select the → or → , or click on the ![]() button on the toolbar. Assuming you have not saved the chart before or selected → , the following dialog will appear:
button on the toolbar. Assuming you have not saved the chart before or selected → , the following dialog will appear:
Save As Dialog
The first option allows you to specify a name and file path for the saved chart. You can browse to the appropriate file path by clicking on the button at the bottom of the dialog. The second option allows you to specify which format you would like to use when saving the chart. As detailed in Chapter 3 - Charting Basics, there are two principle ways in which chart definitions can be saved.
Chart format: | Chart files save the chart in a binary file called |
Template format: | Template files save the chart in a binary file called |
PAC format: | PAC files save the chart in such a way that makes them ready for deployment. A |
Once you select a format you want to use, click on the button and the chart will be saved.
Chart templates are a special format in which chart definitions can be saved. Unlike chart files (.cht format) which saves both the chart definitions as well as the data for the chart, templates only save the definitions (i.e. the chart attributes and the layout of the individual components), and the data source information. This means that templates store the location/connection information for the data source that was used to create the chart, but they store none of the actual data in the file. (Templates do keep 10 records of back-up data, allowing them to be opened when the data source is not present).
Template files can be used in two ways. First, it can be opened, viewed, or exported, allowing you to see a chart with fresh data. This way data for the chart are retrieved based on the data source specified in the file. If the original data source is not accessible, this method cannot be used. The second way in which templates can be used is to apply its attributes to other charts. In this scenario, the chart to which the template is applied will inherit appearance properties of the template (including colors, fonts, size of chart components, position of legends, etc). This feature allows you to produce a consistent look and feel among charts.
The second approach is very useful if you are using the API to generate charts programmatically, using JDBC code or some other data source. You can then use a pre-defined template to control the look and feel of the generated chart without having to define the appearance properties in code or relying on the default chart properties. For more on applying templates in the API, please see Section 10.5.2 - Applying a Chart Template.
You can apply a template in Chart Designer by selecting → . This will bring up a dialog prompting you to specify the template file you want to use.
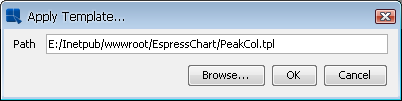
Apply Template Dialog
The dialog allows you to specify the template file and its location. You can browse to a file by clicking on the button.
Note that when the chart and the template being applied are different sizes (i.e. chart canvas size), the resulting chart may not display correctly. This is because the text size will not change between template and chart to which it is applied. While the other components will adjust to the size of the new canvas, the font will not. To keep a consistent look, the size of your template should be close to the size of the chart to which it will be applied.
Hyperlinks, floating lines, floating text, and axis scales defined in the template files carry over. You may have to redefine them in the chart, if necessary. Chart type and dimension are not modified by the template. For example, a three-dimensional chart will not be changed to a two-dimensional chart if the template is a two-dimensional chart. Likewise, a pie chart remains a pie chart when a template of a bar chart is applied. Although the chart type does not change when you apply a template, some appearance properties will not translate very well from a template with another chart type. For best results, try to apply templates of the same type and dimension to a chart.
In addition to the two binary chart representations, you can also save the chart definitions in XML format. This option allows you to have a text-based chart template that can be used to modify chart properties outside of Chart Designer or the API.
To create an XML file when saving the chart, check the Create XML File box in the save as dialog when saving the chart. This will create an XML file for the chart. Note that the XML file is a representation of the .tpl format and not the .cht format.
The other option to specify is whether you would like to create an HTML page to view the chart. The HTML page will redirect to a JSP which contains the Chart Viewer JNLP, which allows end users to view and manipulate the chart. The features of the Chart Viewer are discussed in detail in Chapter 9 - Chart Viewer
To create an HTML page when saving the chart, check the Create HTML File box in the save as dialog when saving the chart. This will create the HTML page with the same name as the chart file under the html// directory of your EspressChart installation. Before the file is written, you will be prompted to select which version of the Viewer that you would like to use.
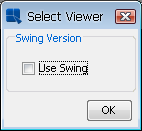
Select Viewer Dialog
EspressChart supports AWT and swing versions of Viewer. Note that if you use Viewer, the client will need to have the Java plug-in.
Once you have created the HTML page, you can point your browser to the page to view the chart. Note that in order for the chart to appear you must load the HTML page vial http protocol. It will not work it you attempt to load it over a file protocol (i.e. browsing to the file and opening it). This means that your EspressChart must be installed in a Web server, and you must access the page via http (i.e. http://machinename:port/EspressChart/yourfile.html) in order for it to load correctly.
There are a number of Chart Viewer options that you can configure from within Chart Designer. These are properties that are saved with the chart, which will appear when the chart is displayed in the viewer. To modify the viewer options, select → . This will bring up the following dialog.
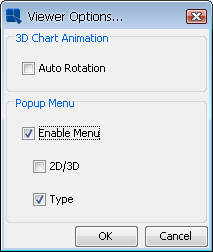
Viewer Options Dialog
The following options are available:
Auto Rotation: | This will enable automatic rotation for three-dimensional charts. The charts will begin to rotate when the applet is loaded. The rotation can be stopped using the appropriate button on the navigation panel. |
Enable Menu: | This allows you to turn on or off the pop-up menu when users are viewing the chart in Chart Viewer. |
2D/3D. | This allows you to turn on or off the dimension toggle in the pop-up menu. If this is turned off, users will not be able to change the chart dimension. |
Type: | This allows you to turn on or off the type sub-menu in the pop-up menu. If this is turned off, users will not be able to change the chart type. |
For .cht files, you can also set a scheduled refresh. This will allow the chart to periodically refresh the data when the chart is being viewed in Chart Viewer. To schedule a refresh rate, select → . This will bring up a dialog, allowing you to set the schedule options.
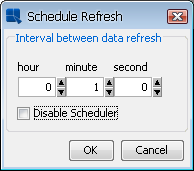
Schedule Refresh Dialog
From this dialog you can set the hour, minute, and second for the refresh interval. If you check the Disable Scheduler box, the Scheduler will be turned off.