Stack Area Chart
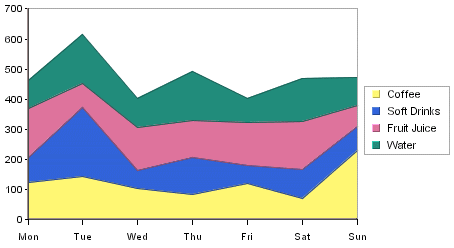
A two-dimensional stack area chart may be viewed as a derivative of a two-dimensional stack column chart but without a data series. This chart may be constructed from a stack column chart as follows: The tops of each stack component that have the same color are joined together by lines. The stack columns are removed and the area between each set of lines is filled with a distinct color.
A three-dimensional stack area chart can have a data series and can also be derived from a three-dimensional stack column chart using the process stated above. In this case, the stack columns for each distinct data series value (a fixed Z-axis value) are joined separately, giving rise to multiple stacks.
Both two-dimensional and three-dimensional stack area charts may be constructed using a similar set of data as needed for their respective stack column chart counterparts. Note, as stated earlier, that a two-dimensional stack area chart cannot have a data series.
Mapping Options for Stack Area Charts
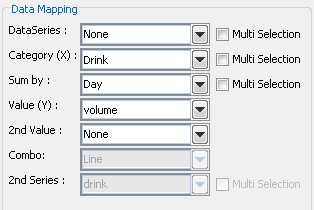
Data Mapping for stack area charts is almost exactly the same as for stack column charts (covered in Section 5.6.1 - Data Mapping). However, two-dimensional stack charts cannot have a data series, and the combo options are Line and Overlay.