Like with reports, it is also possible to add layers of drill-downs to charts. All of the drill-downs added will be applied to both data points on the plot area and their respective fields in the legend. Using chart drill-down, you can create a top-level chart that displays summarized data and allows users to click through specific data points to see underlying details.
The charting engine in EspressReport contains several different built-in drill-down mechanisms that allows you to create only one chart template for each level of drill-down. All of the drill-down options are available from the Drill-Down menu in Chart Designer.
![[Warning]](../../../images/warning.png) | Warning |
|---|---|
It is important to note that you can only use drill-downs in charts when the chart is deployed independently from the report (in the Chart Viewer, its own servlet, etc). If a chart template that includes drill-down is placed in a report, only the top-level chart will display. Users will not be able to click through to the lower-level charts. |
Data drill-down allows you to group and display information that is based on a single data source. The advantage to this form of drill-down is that it works with any data source. However, it does not allow you to display loosely related information because all levels of drill-down will share the same value column from the input data.
For example, assume you have the following table as the chart data:
| Category | Product | Sales |
|---|---|---|
| Chairs | Elm Arm Chair | $8,216 |
| Chairs | Pine Side Chair | $7,611 |
| Chairs | Redwood Arm Chair | $8,625 |
| Tables | Elm Round Table | $10,241 |
| Tables | Pine Oval Table | $9,663 |
| Tables | Oak Oval Table | $11,261 |
| Dressers | Oak Single Dresser | $16,442 |
| Dressers | Elm Double Dresser | $17,148 |
Using this data, you could create a top-level chart that displays total sales for each distinct product category and then create a lower-level chart that shows individual sales for each product in a category. The number of drill-down levels available depends on the number of groupings that are present in the input data.
To add layers of data drill-down to a chart, you must first create a top-level chart. In the above example, we would create a chart with “Category” mapped to the category axis and “Sales” mapped to the value axis. In a column chart, it would look like this:
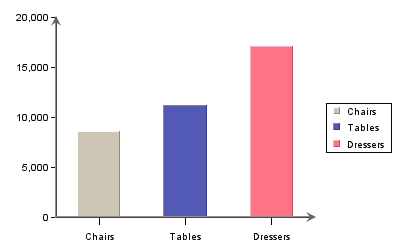
Top-Level Chart
To add a layer of drill-down, select → . This will bring up a dialog prompting you to specify the aggregation you want to use for the value axis. For example, selecting sum will display the total for each category in the top-level chart. Available aggregate functions are minimum, maximum, average, sum, count, first, last, sumsquare, variance, stddev, and countdistinct.
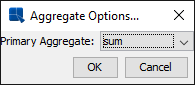
Aggregation Dialog
After you select the aggregation you want to use, click on the button. A new dialog will appear prompting you to specify a name for the drill-down chart. This name will be assigned to the chart templates that are created by the drill-down process. Note that all sub-level drill-down templates are saved in the /drilltemplates/ directory.
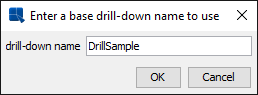
Drill-Down Name Dialog
Once you have specified a name you want to use, click on the button. You will then be prompted to specify the chart type and data mapping for the sub-level chart.
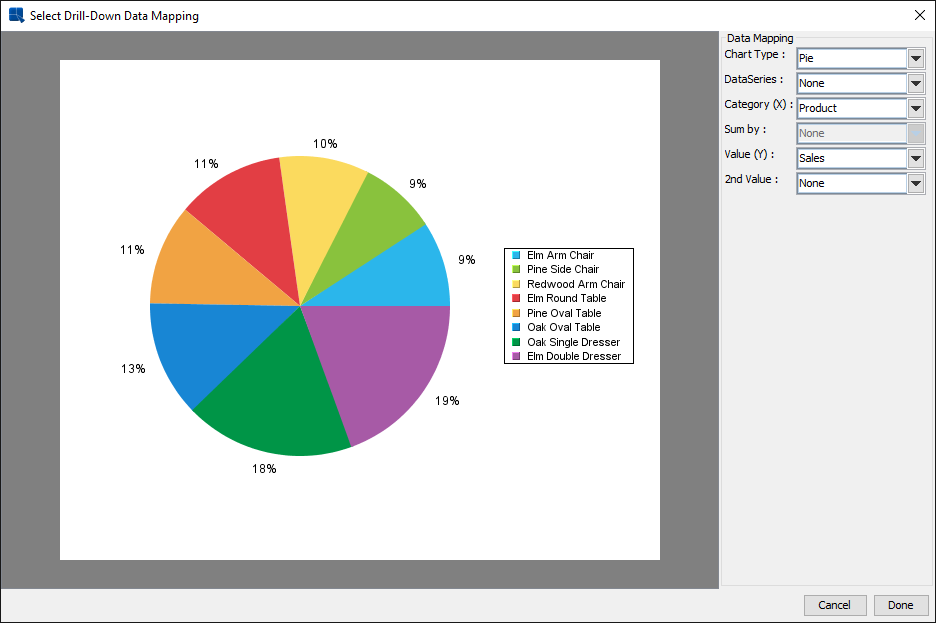
Data Drill-Down Mapping Dialog
The options in the dialog are similar to those for normal data mapping. The major difference is that the first option allows you to select a chart type. Available chart types for data drill-down are column, bar, line, stack column, stack bar, pie, area, doughnut, overlay, radar, and dial. The data mapping options will change depending on the type of chart that you select.
Once you have finished specifying the mapping options, click on the Done button and you will go back to the Chart Designer where you can customize and modify your sub-level chart. You can add additional layers of drill-down by selecting → again.
You can navigate to a particular drill-down chart by selecting → or → or by double clicking a data point. The Previous selection takes you up a level, while the Next selection goes down a level using the left-most category as the data to be drilled on. You can also go from any drill-down chart to the top-level chart by selecting → . You can customize (i.e. assign colors, add title, axis labels, background image, ...etc.) the drill-down chart in the same way as the top-level chart. Everytime you change and leave a level, you will be prompted to save the chart. Make sure that you answer if you want the attributes of the drill-down level to be saved, otherwise you will you lose all the changes.
You can insert a drill-down chart between two other drill-down charts by going to the higher level drill-down chart and selecting → . The drill-down chart that you create will be inserted between the two previous drill-down charts.
You can remove a level of the drill-down by navigating to that level and selecting → . The entire drill-down chart can also be deleted by selecting → . Selecting → brings the drill-down chart to a higher level, which is the same as right clicking and selecting Back from the pop-up menu. The Next selection brings the drill-down chart to a lower level, which has the same function as double clicking on an item in the chart.
Once you have finished creating and editing all the levels of the drill-down chart, you can save it by navigating to the top-level chart and selecting → or → .
Usually, mapping and drill options for data drill-drown are fixed during design time. Dynamic drill-down is an additional option that allows you to select the mapping. The only thing specified during design time is the top-level chart and aggregation.
To create a chart with dynamic drill-down, first create a chart you want to use as the top-level chart (for example, you can create the same top-level chart as before) a then select → . A dialog will appear allowing you to enable dynamic drill-down.
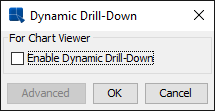
Enable Dynamic Drill-Down Dialog
Check the Enable Dynamic Drill-Down box and a new dialog will pop-up prompting you to select the aggregation.
Aggregation Dialog
Options for this dialog are the same as for regular data drill-down. Once you specify the aggregate you want to use, click on the button. Another dialog will pop-up, allowing you to specify a template you want to use for the sub-level charts.
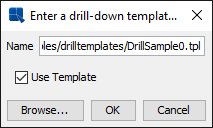
Select Dynamic Drill-Down Template Dialog
If you do not select to use a template, the sub-level charts will be generated using default appearance properties. After you finish selecting these options, your chart will change to display aggregated data on the value axis. You can change the option by selecting → again and then clicking on the button.
Dynamic drill-down charts can only be viewed in the Chart Viewer JNLP (More about Applets in JNLP: Section 1.2.7 - Run Applets in WebStart with JNLP file). There you can configure setting of the next drill-down chart by right clicking on the desktop area which will bring up a pop-up menu. If the dynamic drill-down is enabled and the chart still has some unused fields (columns) to plot, the item Drill-Down will be displayed in the pop-up menu. Upon selecting Drill-Down in the pop-up menu, you can view the current setting for next drill-down. If Category is None, it means you have not configured the next drill-down chart yet. To configure the drill-down chart for next level, you must select Category (Type, Series and SumBy can be selected once Category has been set). After you create a drill-down chart, you can navigate to different levels in the Chart Viewer by either left clicking on a data point if you want to go down one level, or by right clicking and selecting Back from the pop-up menu if you want to go up one level, or by repeating the previous step to create another drill-down chart for next level.
![[Tip]](../../../images/tip.png) | Tip |
|---|---|
After traversing to a lower-level of drill-down, right clicking on a data point will navigate you back to the top-level chart. To bring up the pop-up menu, right click on the chart canvas away from the chart data points. |
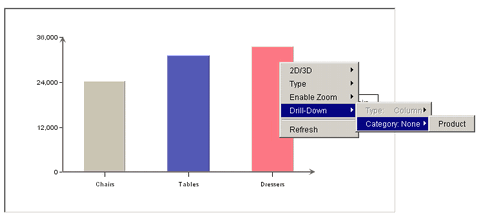
Dynamic Data Drill-Down in Chart Viewer
The third type of a drill-down you can use for charts is a parameter drill-down. Parameter drill-down is the most flexible implementation because you can relate the data between drill-down levels in any way you like. Specifically, you do not need to use the same value element for each level. Instead, parameter drill-down uses parameterized query feature to relate various chart levels and since it uses queries, the data source for the sub-level charts must be a database or parameterized class file.
For example, using our previous scenario, rather than always looking at sales, you want your top level chart to look at aggregated sales by category (same as before), then on the next level, you want to look at sales volume for each product, and from there, you want to look at inventory levels for each product by region. This can be accomplished with parameter drill-down.
With parameter drill-down, the category value of an element you click to drill on will be passed to the sub-level chart as the parameter value. Hence, if you click on the “Chairs” column, the value of “Chairs” would be passed to the query. Therefore, anything in the database that could be filtered by category name could be retrieved.
To add and edit various layers of a parameter drill-down, select → . This will bring up a navigation window that shows various levels of drill-down.
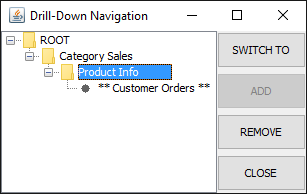
Parameter Drill-Down Navigation Window
Left-hand side of the navigation window displays the hierarchy of drill-down levels. The “ROOT” node is the top-level chart. The level you are currently editing is marked with **. To edit a different level, select it and click the button on the right-hand side. The chart will then open in the Designer. Levels of drill-down can also be removed by selecting the node in the Navigation window and then clicking on the button.
To add a new level of drill-down, select the chart under which you would like to add the layer (if you have only the top-level chart, then only the “ROOT” node will be visible), and click . You will then be prompted to create a new chart or to use an existing chart for the drill-down layer. You can use any existing chart; however, any chart for a drill-down layer must have a parameterized query as the data source. If you select to create a new chart, the Data Source Manager will reopen, allowing you to select a data source for the chart and to continue through the Chart Wizard steps.
The next step is to map the category and/or series columns from the top-level chart to the query parameter(s) in the sub-level chart. You will be prompted to do this when you select an existing chart for the drill-down layer or when you select the data source for a new chart for the drill-down layer. In either case, a dialog will appear prompting you to map the fields.
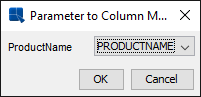
Parameter Mapping Window
Available options in the drop-down menus are based on data type. For example, if your parameterized query has string as the parameter, only fields containing string data can be mapped. Hence, it is important to consider what type of data will be passed from the top-level chart to the lower-level charts because if your category or series are not of the correct data type or if you do not have enough fields to pass to the lower-levels, the drill-down will not work correctly.
Once you correctly specify the parameter mapping, you will be prompted to specify a display name for the drill-down level. After you select a name, the sub-level chart will appear in the Designer, allowing you to customize it. You can navigate through the layers of drill-down using the Navigation window, or like data drill-down, you can double click on a data point to go down a level and right click and select Back from the pop-up menu to go up a level.