After you log into the ERES Cloud, the main page will open. From this page, you can access all ERES Cloud features:
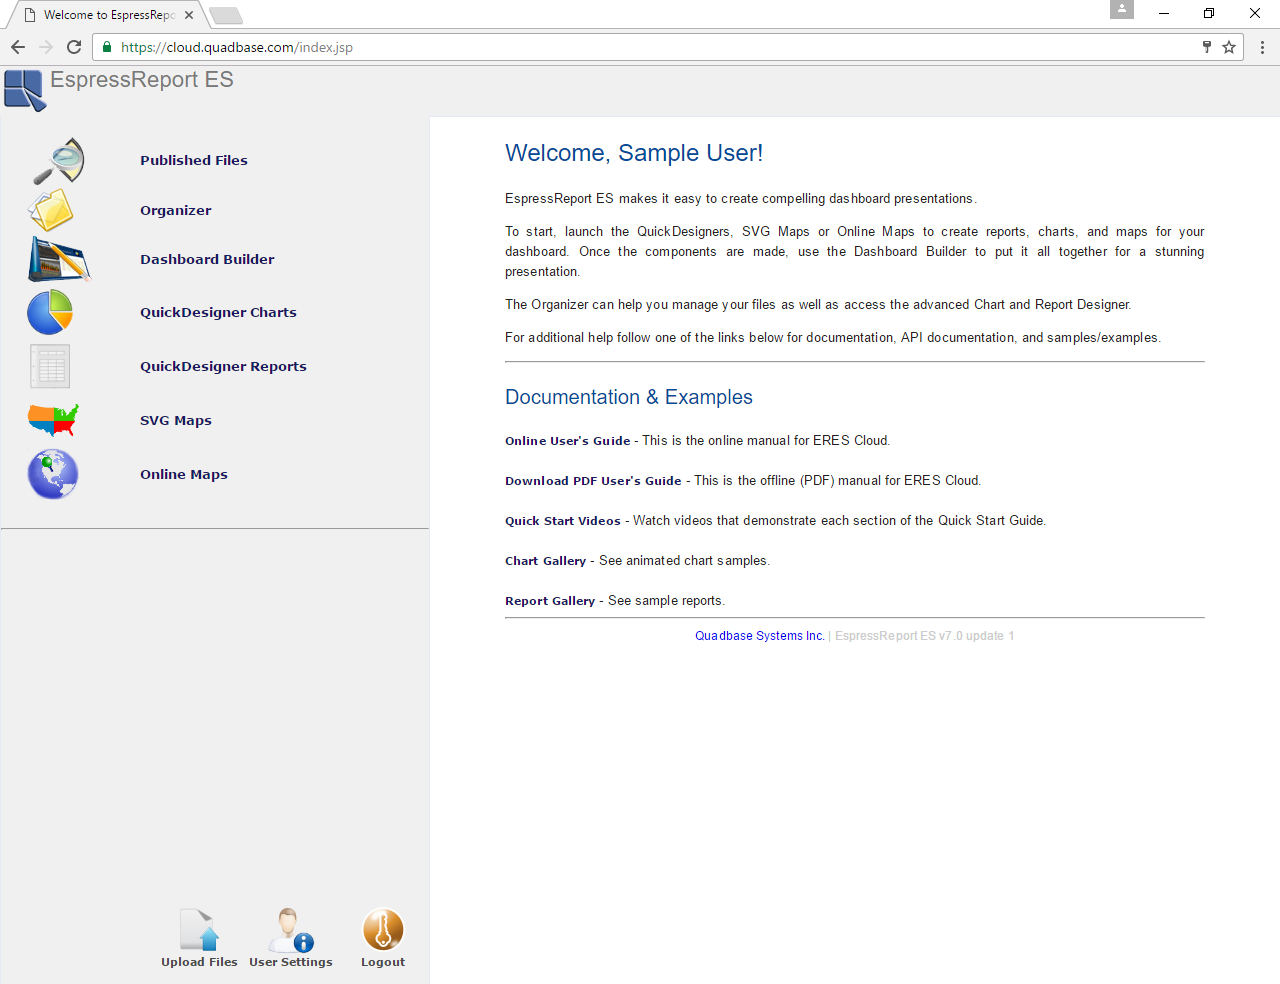
ERES Cloud Main Page
Published Files | Shows list of all charts, reports and dashboards you have created and also some example for you to try. For more details, see the Chapter 8 - Publishing (Menu & URLs) chapter. |
Organizer | Organizer allows you to manage all files (charts, reports, dashboards, data sources etc.), organize the files into folders, manage your data sources and also launch the full version of the Chart Designer. Organizer documentation can be found in Chapter 3 - Organizer. |
QuickDesigners | Create or edit charts and reports quickly and easily. To learn how to use the QuickDesigners, see Section 5.3 - QuickDesigner Reports and Section 5.4 - QuickDesigner Charts . |
Map Designers | Allows you to visualize your data on maps. More on SVG Maps and Online Maps can be found in the Chapter 6 - Designing Maps chapter. |
Dashboard Builder | After you have created some templates (i.e. reports, charts, and maps), you can publish them in well-arranged dashboards. See Chapter 7 - Designing Dashboards to learn more. |
Upload Files | Upload Excel data spreadsheets, other data sources, images, etc. and use them for your charts, reports, and maps. To learn more, see Section 2.1 - Upload Files. |
User Settings | Allows you to change your email address and password. |
To manage data sources, click on the button on the ERES Cloud main page. The following dialog will show up.
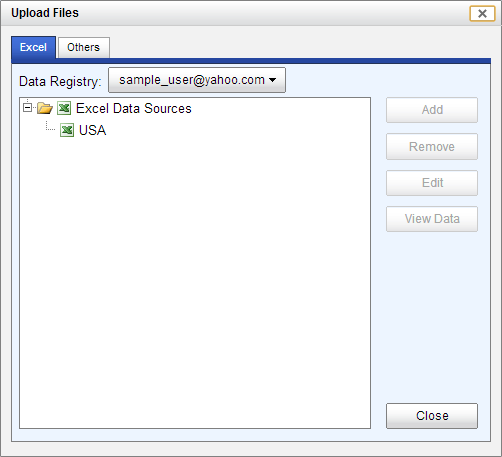
Upload Files
You can see two tabs in this dialog. Excel tab allows you to upload and manage your Excel data sources. Others tab allows you to upload and manage other files (e.g. images, text data sources).
You can manage your own Excel data sources from Excel tab of the Upload Files dialog.
There are four buttons on the Excel tab:
Allows you to upload a new excel file and create a data source from it.
To delete a data source, select a data source node on the left and click on the button.
![[Warning]](../../../images/warning.png)
Warning This action can't be undone!
Select an existing data source on the left and click on the button in order to modify the data source. This will open the same dialog that is described in the Section 2.1.1.1 - Add/Modify Excel Data Source chapter.
To preview a data source, select the data source on the left and then click on this button. First 50 rows of the data will be displayed.
If you click on the button on the Excel Data Sources dialog (as described in the previous paragraph), the following dialog will show up.
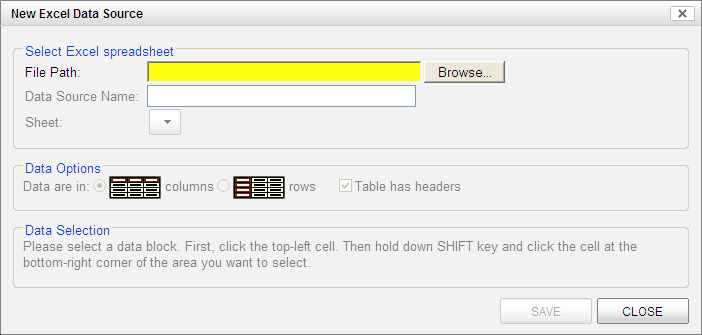
Add New Excel Data Source Dialog
If you want to create a new data source, first you have to upload an Excel file. Click on the button, select an excel file and click . Data from the file will be displayed in the Data Selection section.
![[Note]](../../../images/note.png) | Note |
|---|---|
Only raw data are shown in the Data Selection table. No formatting (e.g. different fonts, colors, etc.) will be displayed. |
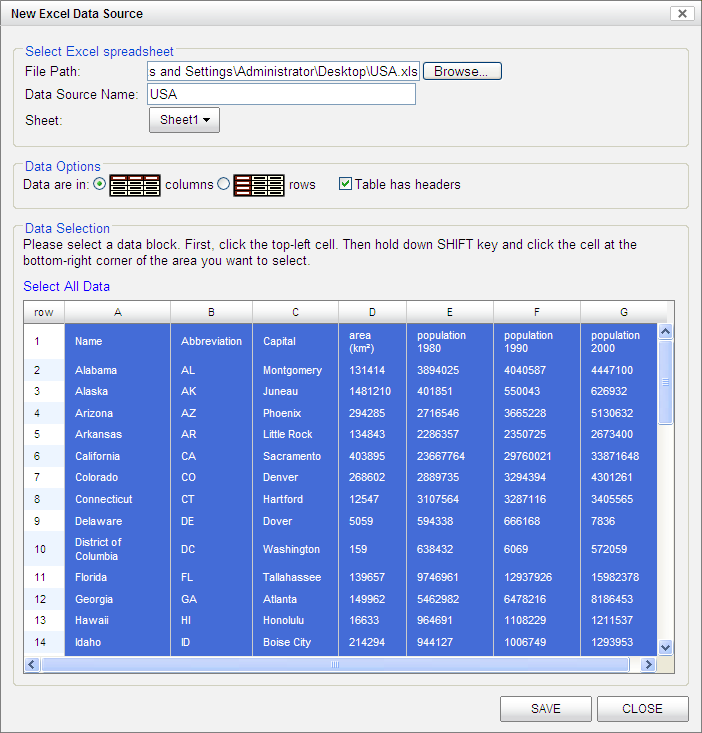
Add/Modify excel Data Source Dialog
- Data Source Name
This name will be used in ERES Cloud for this data source. By default, the excel file name will be used, but it can be easily changed to any other name.
- Sheet
An excel file usually contains several sheets. Use this drop-down menu to switch between sheets. If you switch to another sheet, its data will be shown in the Data Selection table.
- Data are in columns/rows
Allows you to set orientation of the data table. Data in columns mean, that each table column contains values of the same variable (for example: number of items in stock, product price etc.). Also, if you select the Data are in columns option, values in each column should have the same data type (except for header which is always converted to String). The same logic is applied to data in rows.
For example: take a look at the previous picture. Data in the picture are in columns, because each column contains data of a certain kind (for example: state name).
The Table has headers check-box allows you to use first field of each selected column/row as its header. If you want to use headers, you have to select the header row/column in the Data Selection table along with the data (as seen in the previous picture).
Note If you choose the Data are in rows option and save the data source, the data orientation will be automatically transposed to vertical orientation (i.e. data will be in columns).
- Data Selection
Allows you to select the data that will be used in the data source. By default, all non-empty cells are selected. If you want to exclude some columns/rows from the table or if an excel sheet contains several tables, you can narrow the selection in the Data Selection table. To do that, select a corner cell, then press the SHIFT key and then click on the opposite corner cell.
After you have finished configuring the data source, click on the button to insert the data source into your data registry.
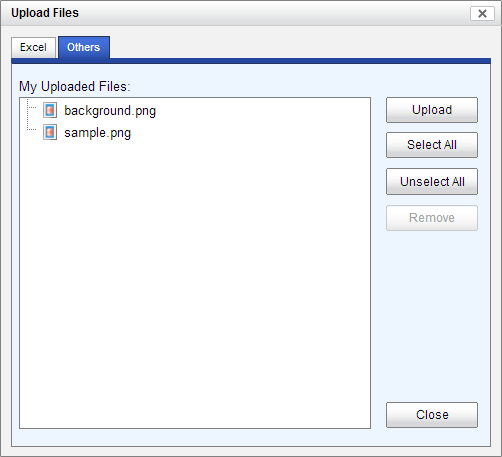
You can upload your own files from Others tab of the Upload Files dialog.
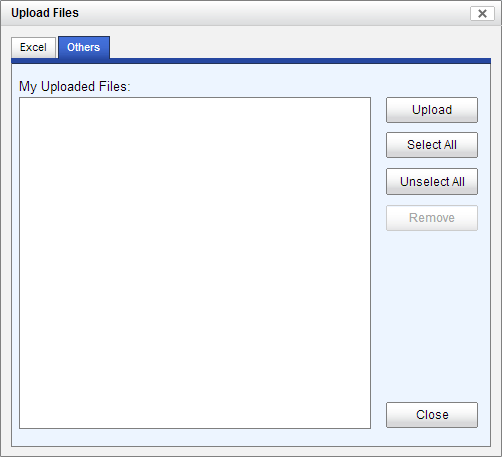
Upload Your Own Files
There are four buttons on the Others tab:
Allows you to upload the files from your local computer. To do this click the Upload button. The next dialog will appear.

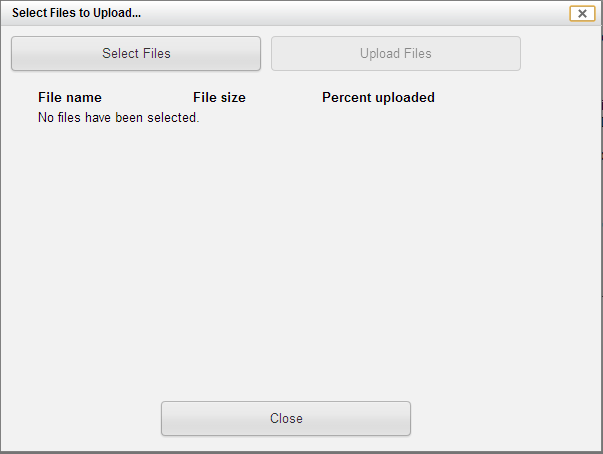
Select Files Dialog
Click the button. Your local computer directory will be opened to select the file. Select one or more files and confirm the selection. Your files are added to the Select Files to Upload dialog now.
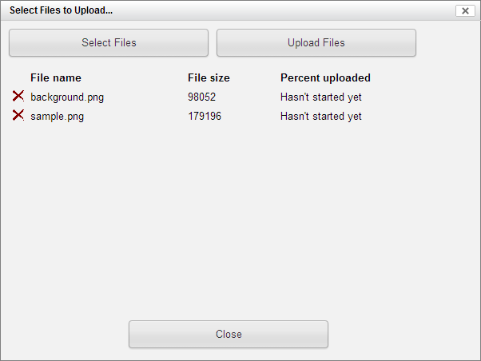
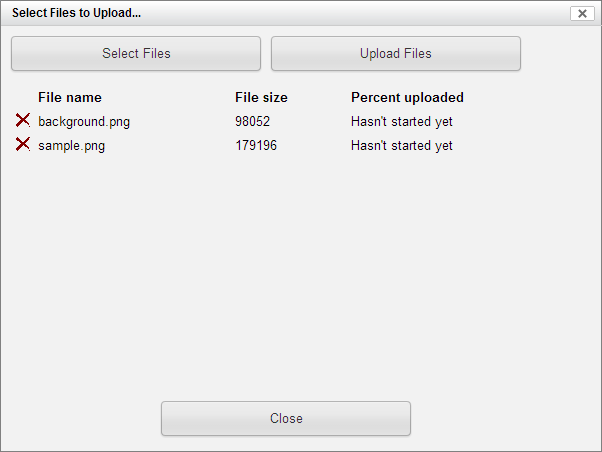
Select Files To Upload
Click the button. Your files are uploaded and you can see them in the Upload Files dialog. Your files were saved to the Uploads directory and you can use them by Browse function (e.g. from Report Designer).

Uploaded Files
Allows you to select all uploaded files to remove them.
You can unselect all selected files.
Allows you to remove your uploaded files.