EDAB also provides the QuickDesigner interface which provides a thin-client interface for creating ad-hoc queries, and reports. In this chapter, we will create a query and a report using QuickDesigner.
To start QuickDesigner, go to the EDAB Start page, and login using the user created in Section Q.2.1 - Create a User. When you login click the link labeled Quick Designer to launch QuickDesigner.
The first screen that you will see when you start QuickDesigner is a dialog asking you if you want to create a new report/chart or open an existing one.
Create New or Open Existing
Click on to create a new report/chart. The next screen is a dialog prompting you to select the data registry that you would like to use (if you have more than one data registry. If only one exists, that data registry is selected automatically and the choice for picking a data registry is skipped).
Select Data Registry Dialog
If you have only one data registry, skip to the next paragraph, otherwise, pick the one that you created in Section Q.3.1 - Create a Data Registry, and click the button. The next screen will show all of the defined data sources in the registry.

Data Registry Dialog
Expand the nodes and select the Data View that you created in Section Q.3.1.3 - Create a Data View and click the button. A new dialog will open, showing the headings and fields for the view on the left. Add the following fields from the Order Info heading by clicking them in the left-hand side.
Order ID
Order Date
Product Name
Unit Price
Quantity
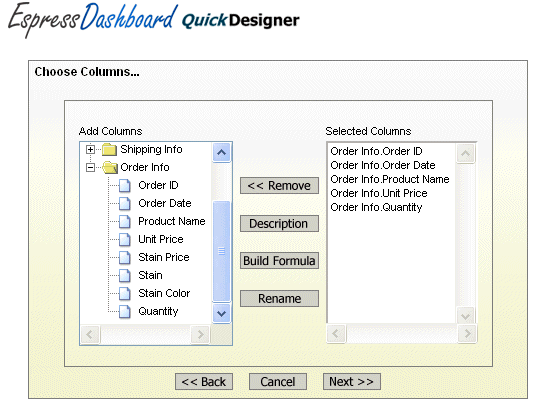
Column Selection Dialog
After adding the columns, click the button to build a computed column. This will launch the Formula Builder in a new window.
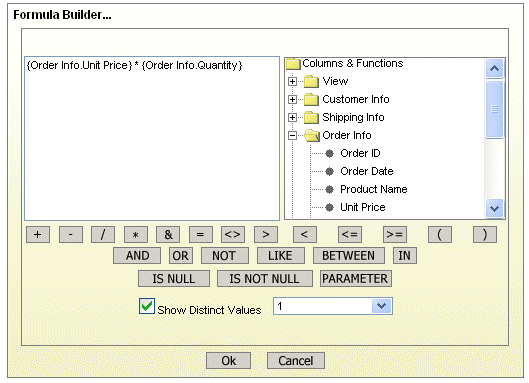
Formula Builder
In the Formula Builder, expand the View node in the right-hand side. Then expand the Order Info node. Under this node click the Unit Price entry. The text will be added to the main Formula window. Then click the button. Then select the Quantity field. The finished formula should look like this:
{Order Info.Unit Price} * {Order Info.Quantity}Once you have finished, click to add the formula. A new column will be added in the column selection dialog.
To provide an alias for the expression column, select it and click the button. This will bring up a dialog allowing you to specify the alias.
Rename dialog
Enter an alias for the computed column and click . Next, click the button to submit the column selection. The next dialog that opens allows you to set sorting, grouping, and conditions for the data view query.

Conditions Dialog
In this dialog, set the sorting to be ascending for the Order ID column. Then uncheck the option marked Show for the Order Date column. This column will only be used for filtering. Next, click the button for the Order Date field. ![]() This will launch a dialog allowing you to specify a filtering condition for the field.
This will launch a dialog allowing you to specify a filtering condition for the field.
Condition Operators Dialog
Select the radio button marked Select condition values from column and then click the button. This will open another dialog allowing you to select a date range by which to filter the query.
Select Conditions Dialog
Select the date range that you would like and click . The condition will be added for the Order Date field. Now you can preview the finished query by clicking the button.
Next, click the button to save this data view query back to the registry. This will bring up a dialog prompting you to select a name for the query.
Save Query Dialog
Enter the name you would like to use for the query and click . A message will appear indicating that the query was saved successfully. Click again to close the dialog.
Now that you have completed the query, click to begin creating the report. A dialog will appear, showing you the first ten records from the query. Options at the bottom of the screen will allow you to select to create a chart or a report using the data.

Query Results Dialog
Click the button to continue. The next dialog will prompt you to specify any grouping or aggregation for the report.
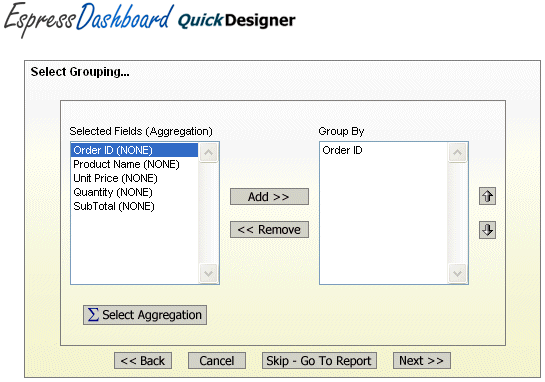
Set Grouping Dialog
Select the Order ID field and click the button. This will add a level of grouping in the report for this field. Then click the button. This will bring up a dialog allowing you to specify summaries for fields in the report.
Select Aggregation Dialog
Select the the last computed column in the upper drop-down list, then select SUM in the lower list. Then click to save the changes. The aggregation will be reflected in the set grouping dialog.
After you finish with the grouping and aggregation, click the button. This will bring up a dialog allowing you to select a default look and feel for the report.

Select Report Style Dialog
Select the List Break Left style and click the button. Your report will then open in the main QuickDesigner interface.
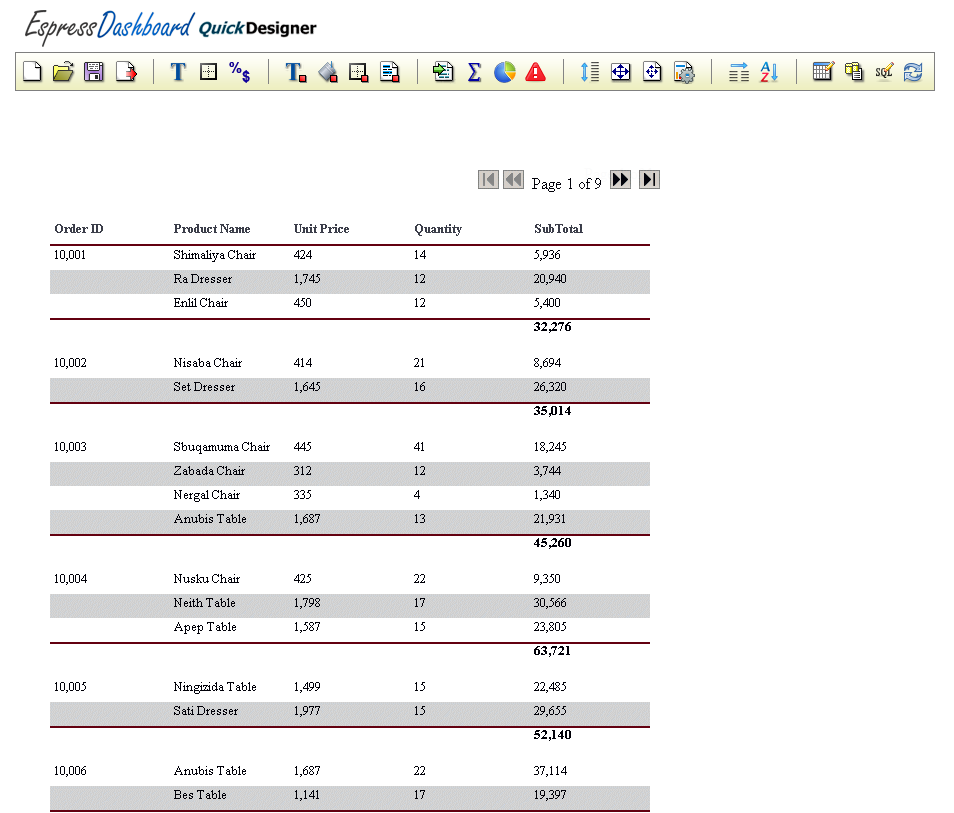
QuickDesigner Interface
The QuickDesigner, like the Report Designer, allows you to modify and format certain report properties. To begin modifying the report that you have created, click the button on the toolbar. ![]() A dialog will open allowing you to set the font for all the different types of elements in the report.
A dialog will open allowing you to set the font for all the different types of elements in the report.
Font Style and Size Dialog
The drop-down list in the top of the dialog allows you to select a type of report element. For each type, fonts can be set using the other options in the dialog. Set the fonts for Column Headers (select all the column headers), Labels, and Formulas to be Arial, Bold, and 8 point size. Set the font for Columns (again, select all the columns) to be Arial, Plain, and 8 point size. Then click to save the changes.
Next, click the Dual Colors button on the toolbar. ![]() This will bring up a dialog allowing you to set options for the alternating colors in the report.
This will bring up a dialog allowing you to set options for the alternating colors in the report.

Dual Colors Dialog
The buttons at the bottom of the dialog allow you to select the font as well as the background color for the alternating rows. Click the button. This will open a new dialog.
Dual Colors Font Style Dialog
Select 8 point Arial font to match the font you selected for the columns in the font dialog. Click to save the changes. Click again to close the dual colors dialog.
Next, click the button on the toolbar. ![]() This will open a new dialog allowing you to add elements to the report.
This will open a new dialog allowing you to add elements to the report.
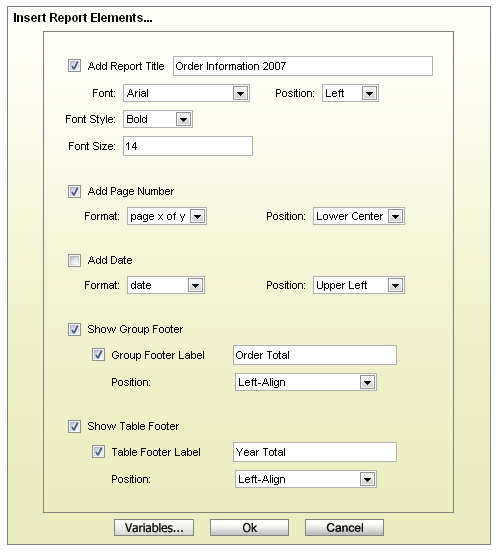
Insert Elements Dialog
In this dialog, click the option marked Add report title and add a title in the space provided. Select a 14 point Arial font for the title and set the alignment to the left. Next, click the option marked Add page number. Select the page number format that you would like and elect to add it in the lower-center of the report. Finally, check the Group Footer Label and Table Footer Label options and add labels for the Group and Table footer sections of the report. Once you have set the options, click to save the changes.
For more detail about all the formatting options available in QuickDesigner, see Section 3.10 - The QuickDesigner Interface.

Report with Changes Applied
Now that you have finished formatting, you can save the report you have created back to the Organizer so that other users can view it. To save the report, click the button on the toolbar. ![]() This will bring up a dialog allowing you to specify a name for the template.
This will bring up a dialog allowing you to specify a name for the template.

Save Report Dialog
Enter a name for the report, and from the lower drop-down list, select the project that you created in Section Q.2.2.1 - Login as User. Click to save the report. The window will then give you a message to indicate that the report was saved successfully. Click to close the dialog.
Note that all saved files will include the userID and the timestamp in addition to the name you have provided. If an Organizer item with the supplied name exists in the folder, you will be given a choice to override the existing item or create a new entry. If you wish to save the changes in the existing report that you have opened, then do not change the report name and the Organizer folder in the Save Report dialog and the report file will be updated.

Report Overwrite Dialog
With the QuickDesigner still open, click the button on the toolbar. ![]() You will be taken back to the QuickDesigner data registry representation, where you can select a data source for the new report or chart.
You will be taken back to the QuickDesigner data registry representation, where you can select a data source for the new report or chart.
In the Data Registry, select the Sample.dat text file data source that you created in Section Q.3.1.4 - Setup a Text Data Source and click . A dialog will open showing the first ten records of the text file. It prompts you to select to build a chart or a report with the data. Click the button to continue.
The next dialog allows you to select the chart type and mapping options. Elect to create a 2D High Low chart using the first options in the dialog.
Chart Mapping Dialog
For the mapping options select year as the data series, Day as the category, high as the high, low as the low, and close as the close. Click to go the main Designer interface.
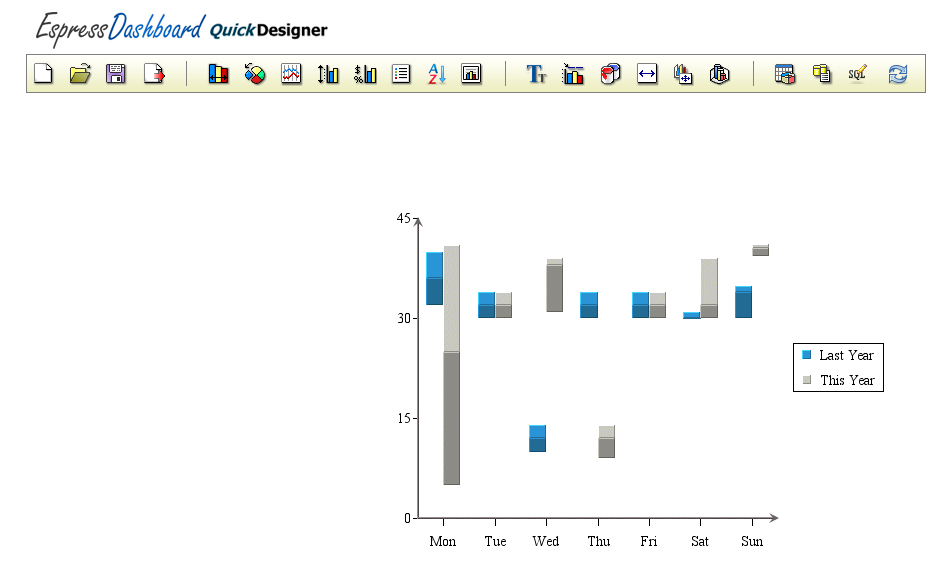
Chart Designer Interface
Click the button on the toolbar. ![]() This will bring up a dialog allowing you to set the size of the chart canvas. Set the size to be 400 by 300 pixels and click . Charts, like reports in QuickDesigner, must be manually refreshed.
This will bring up a dialog allowing you to set the size of the chart canvas. Set the size to be 400 by 300 pixels and click . Charts, like reports in QuickDesigner, must be manually refreshed.
Chart Canvas Size Dialog
Next, click the button on the toolbar. ![]() This will bring up a dialog allowing you to set display options for the chart legend. Change the Layout option to Horizontal, the Position option to Bottom, and un-check the Border option. Click to apply the changes.
This will bring up a dialog allowing you to set display options for the chart legend. Change the Layout option to Horizontal, the Position option to Bottom, and un-check the Border option. Click to apply the changes.
Format Legend Dialog
Next, click the button on the toolbar. ![]() This will bring up a dialog allowing you to set the font options for the different text elements in the chart. From the drop-down list in the top of the dialog select X Axis Labels. Then set the font to be Arial, 8pt, and plain.
This will bring up a dialog allowing you to set the font options for the different text elements in the chart. From the drop-down list in the top of the dialog select X Axis Labels. Then set the font to be Arial, 8pt, and plain.

Chart Font Dialog
Now repeat this process for the Y axis labels and the legend text, setting them all to be Arial, 8pt, and plain.
Finally, click the button on the toolbar. ![]() This will open a new dialog that allows you to adjust the size and position of the chart plot within the canvas. Using the sliders, modify the chart position so that the relative X and Y Positions are both 0.1. Change the relative width to be 0.8, and the relative height to be 0.7. Click to apply the changes.
This will open a new dialog that allows you to adjust the size and position of the chart plot within the canvas. Using the sliders, modify the chart position so that the relative X and Y Positions are both 0.1. Change the relative width to be 0.8, and the relative height to be 0.7. Click to apply the changes.

Chart Size/Position Dialog
For more detailed information about all the chart formatting options available in the QuickDesigner, see Section 3.12 - Charts in QuickDesigner.

Finished Chart
Now that you've finished formatting the chart, you can save it back to the Organizer. To save the chart, click the button on the toolbar. ![]() This will bring up a dialog allowing you to specify a name for the chart.
This will bring up a dialog allowing you to specify a name for the chart.
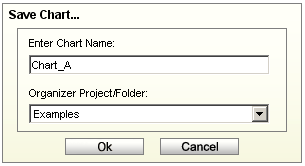
Save Chart Dialog
Enter a name for the chart, and from the lower drop-down list, select the project that you created in Section Q.2.2.1 - Login as User. Click to save the chart. The window will then give you a message to indicate that the chart was saved successfully. Click to close the dialog.
Note that all saved files will include the userID and the timestamp in addition to the name you have provided. If an Organizer item with the supplied name exists in the folder, you will be given a choice to override the existing item or create a new entry. If you wish to save the changes in the existing chart that you have opened, just do not change the chart name and the Organizer folder in the Save Chart dialog and the chart file will be updated.
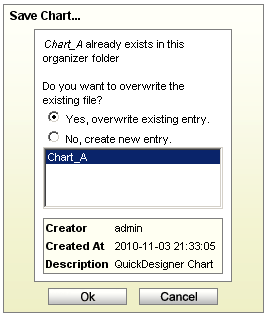
Chart Overwrite Dialog
Click to close the dialog and then click the button in the upper right-hand corner to close QuickDesigner and return to the EDAB Start page.