All charts created by Chart Designer can be saved in a range of file formats that may be pasted into documents. These formats include BMP, JPG, PNG, PDF, SVG, SWF, WMF, and GIF. In addition, Chart Designer provides the option of saving a chart as a .cht, .tpl, or .xml file.
Chart Viewer is an applet that enables you to view and manipulate a chart dynamically through a web browser. Viewer reads the file (in .cht or .tpl format) as outputted by Chart Designer or the API, and then displays the chart. The small size of the data file makes it suitable to distribute the chart image over the web. The data is encrypted while being transferred from EspressManager to Chart Viewer and so lends a degree of security to sensitive information.
Files in the .tpl format can also be viewed using Chart Viewer. When a web page that contains a .tpl file is viewed using a browser, fresh data will be obtained automatically by Chart Viewer. Thus, a single chart template can be used to supply up-to-the-minute charts to users in real time.
Inside Chart Viewer, you can drag the chart, legend, title, or label to position the object. You can also resize the chart and drill-down on data points or a series of data. For three-dimensional charts, users can use the navigation panel to pan, zoom, rotate in each direction, and translate. Also, individual x, y, and z-axis scaling, thickness ratio adjustment, real time three-dimensional animation, etc can all be preformed easily. There are built-in callback mechanisms that let a user click on a data element to view the underlying data or to jump to a related URL. Chart Viewer is written in pure Java that runs on all platforms that support Java. Chart Viewer also supports scheduled refresh (where a chart’s data is updated at regular intervals specified by the designer) and parameter serving where a chart’s parameters are provided at load time.
Chart Viewer is an applet that allows you to view and manipulate a chart dynamically through a web browser. The Viewer can read chart files (.cht), template files (.tpl) and chart XML files. Chart Viewer can be automatically embedded in a menu page, in an HTML page, or manually placed in a web page.
Inside the applet, you can drag the chart, legend, title, or label to position the object. You can resize the chart and drill-down on data points or a series of data. For three-dimensional charts, users can use the navigation panel to pan, zoom, rotate in each direction, and translate. Also, individual x, y, and z-axis scaling, thickness ratio adjustment, real time three-dimensional animation, etc can be preformed easily. There are built-in callback mechanisms that let a user click on a data element to view the underlying data or to jump to a related URL. Chart Viewer also supports scheduled refresh (whereby a chart’s data is updated at regular intervals specified by the designer).
To embed Chart Viewer within a menu page, simply select CHT as one of display options when viewing the menu page. For more information about the menu page, please see Section 6.1 - The Menu Page.
To create a stand-alone HTML page with the Viewer embedded, check the Create HTML File option when saving a chart in the Chart Designer.
In addition you can embed the Viewer with your own Web page using the following syntax:
<applet codebase = ".." code = "quadbase.chartviewer.Viewer.class"width = 640 height = 480 archive = "EspressViewer.html">

      <PARAM name = "filename" value = "yourchart.cht">

</applet>
The parameter filename specifies the file name of the file that contains the chart data and you can prefix it by http:// for accessing a remote data file. When viewed by Chart Viewer, a chart saved in the chart format (.cht) will use the data stored in that file for plotting.
A chart saved in the template format (.tpl) allows Chart Viewer to dynamically fetch the data from a database or a data file depending on where you specify the data source of chart to be when using Chart Designer to create the template (the database name, user name, password, etc are all stored in the .tpl file).
You can also pass data and chart viewing control information via parameters to the Chart Viewer applet without using Chart Designer. That is, you can use the Chart Viewer to directly view a data file or pass the data directly in the form of lines of data, along with other control information, in the HTML code. By default, the parameter is true if the parameter is of a true/false type. The following is a list of parameters:
Chart Parameters (Common to Two and Three-Dimensional Charts):
mainTitle | the main title of the chart |
xTitle | x-axis title |
yTitle | y-axis title |
zTitle | z-axis title |
RefreshInterval | scheduled refresh interval in seconds |
DragLegend | if false, the legend(s) can not be moved |
DragChart | if false, the chart can not be repositioned or resized |
ShowDataHint | if false, data information box will not be shown when left mouse click on chart data |
ShowLinkHint | if false, hyperlink information box will not be shown when right mouse click on chart data |
DataHintBgColor | set background color of data information box |
LinkHintBgColor | set background color of hyperlink information box |
DataHintFontColor | set font color of data information box |
LinkHintFontColor | set font color of hyperlink information box |
DataHintFont | set font of data information box |
LinkHintFont | set font of link information box |
DataHintOffsetX | set x offset of the data information box |
DataHintOffsetY | set y offset of the data information box |
LinkHintOffsetX | set x offset of the link information box |
LinkHintOffsetY | set y offset of the link information box |
Printing | if false, this will disable the ability to export the chart (using Ctrl+P and/or Ctrl+J) in a browser |
filename | name of the template file to be applied to the chart |
xAxisRuler | if true, show the x-axis ruler (for 2D charts only) |
yAxisRuler | if true, show the y-axis ruler (for 2D charts only) |
sAxisRuler | if true, show the secondary-axis ruler (for 2D charts only) |
ResizeChart | if false, the chart cannot be resized |
ResizeCanvas | if false, the canvas cannot be resized |
comm_protocol | the protocol to be used, to connect to the ERES Server |
comm_url | the URL to connect to the ERES Server |
servlet_context: | the context in which the ERES Server is running |
RefreshData | if false, the chart data cannot be refreshed |
PopupMenu | if false, the pop-up menu will not be displayed |
TypeMenu | if false, the type sub-menu will not be displayed in the pop-up menu |
DimensionMenu | if false, the dimension sub-menu will not be displayed in the pop-up menu |
For Three-Dimensional Charts only
Toggle3Dpanel | if false, the navigation panel can not be toggled to be visible or invisible |
Drawmode | set different mode of drawing 3D chart. Available draw modes are |
NavColor | set navigation panel color |
navpanel | if false, the Navigation Panel is not displayed when a 3D chart is being viewed. The Navigation Panel is never displayed when a 2D chart is being viewed |
GouraudButton | if false, the Gouraud shading button in the navigation panel is hidden |
AnimateButton | if false, the animation speed control in the navigation panel is hidden |
SpeedControlButton | if false, the speed control button in the navigation panel is hidden |
Data Input Parameters
sourceDB | set the database information in order to generate the chart |
sourceData | set the data information in order to generate the chart |
sourceFile | set the datafile information in order to generate the chart |
datamap | set the column mappings for the chart |
TransposeData | set the data to be transposed before using it to generate the chart |
chartType | set the chart type for the generated chart |
ParameterServer | update the data in the chart dynamically |
transposeData | if true, transpose the data |
Example:the parameters mainTitle, xTitle, yTitle, and zTitle are used to specify the main title and axis title of the chart, they will override the ones defined in the template:
<PARAM name="mainTitle" value="This is the main Title">
<PARAM name="xTitle" value="x axis title">
<PARAM name="yTitle" value="y axis title">
<PARAM name="zTitle" value="z axis title">
Example:With the parameter RefreshInterval you can specify:
<PARAM name="RefreshInterval" value="60">
In the above example, the applet will fetch data from a database or data file (with the help of the server) and redraw the chart every 60 seconds - all transparently. It is useful for accessing databases in which the data changes frequently.
Using parameters, you can specify a data source for the Chart Viewer in order to display different data with a chart template or create a chart from scratch.
This is some sample HTML code that uses the Chart Viewer to view a chart drawn using data extracted from a database.
<applet code = "quadbase.chartviewer.Viewer.class" width=640 height=480>

      <PARAM name="sourceDB" value="jdbc:odbc:DataSource, sun.jdbc.odbc.JdbcOdbcDriver, username, password, select * from products">
      <PARAM name="dataMap" value="0 1 -1 3">
      <PARAM name="chartType" value="3D Column">

</applet>
The arguments of dataMap specify how the chart utilizes different columns from the input data to plot the chart. In case of a scatter chart, they are series, x-value, y-value, and z-value. For a high low open close or high low chart the numbers are series, category, high, low, open, and close. For all other charts, the arguments are series, category, sumBy, and value. If you would like more information,please see the chapter on Column Mapping in the Chart API reference. The argument chartType specifies the type of chart to be displayed and it can be one of:
2D Column
3D Column
2D bar
3D bar
2D stack bar
3D stack bar
2D stack column
3D stack column
2D area
3D area
2D stack area
3D stack area
2D line
3D line
2D pie
3D pie
2D scatter
3D scatter
2D High Low
3D High Low
2D HLCO
3D HLCO
2D 100% Column
3D 100% Column
3D Surface
2D Bubble
2D Overlay
2D Box
2D Radar
2D Dial
2D Gantt
2D Polar
This HTML code draws a chart using data from a data file:
<applet code = "quadbase.chartviewer.Viewer.class" width=640 height=480>

      <PARAM name="sourceFile" value="http://.../test.dat">
      <PARAM name="dataMap" value="-1 0 -1 1">
      <PARAM name="chartType" value="3D Pie">

</applet>It is possible to have Chart Viewer read in data directly from the HTML file itself rather than from a data file or from a database.
<applet code = "quadbase.chartviewer.Viewer.class" width=640 height=480>

      <PARAM name="sourceData" value="int, string, int | value, name, vol | 10, 'John', 20 | 3, 'Mary', 30 | 8, 'Kevin', 3 | 9, 'James', 22">
      <PARAM name="dataMap" value="-1 1 -1 2">
      <PARAM name="chartType" value="3D Bar">

</applet>
The format for the parameter sourceData is the same as the data file format, except that each line is ended by a vertical bar “|”.
You can manipulate the chart appearance simply by using the mouse in Chart Viewer. For three-dimensional charts, Chart Viewer screen comprises of two sections: the drawing panel and the navigation panel. Only the drawing panel is visible for two-dimensional charts. Within the drawing panel, the chart itself is located on the plot area.
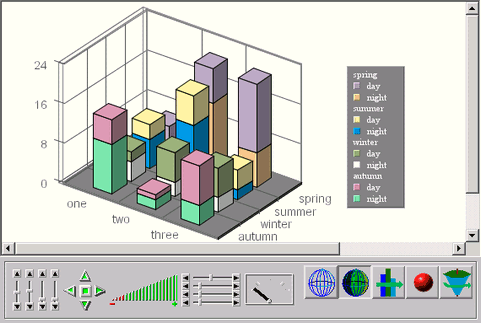
A Sample Chart Viewer Display
Below is a list, not by order or importance, of chart manipulations that are possible when using Chart Viewer:
Using the navigation panel, you can:
Change light position
Rotate the chart
Translate the chart
Zoom in/out on the chart
Scale the chart in x, y, z dimension
Adjust the thickness ratio of bar/line/point/pie
Start the chart animation and control the speed of the animation
Toggle between wireframe and solid mode
Draw a black outline on all edges of the chart
Perform Gouraud shading
Drag the left mouse button on the chart, main title, x, y, and z-labels, or legend to move the item
Drag the right mouse button on plot area to resize the chart
Press the Alt key and drag the right mouse button on plot area to resize the canvas
To toggle the navigation panel (show and hide), double click the left mouse button on the drawing panel
Using the mouse you can also query data points individually
Left single click on a data point to view the data associated with that point
A right single click on data provides the name of the hyperlink associated with the data point
Left double click to jump to the hyperlink associated with the data point. (Note that this creates a new browser window. Users can not use the button on the browser to return to the previous chart)
Right double click to jump back to the previous chart (if appropriate)
Use Alt+Z to specify the zoom-in parameters
Use Ctrl+R to refresh data manually
Use Ctrl+Left Click to select the bounds to zoom in and Ctrl+Right Click to zoom out
There is now an option to show Axis Rulers in Chart Viewer (by setting a parameter {axisRuler} in the applet tag) and Chart API (Please refer to the API Documentation quadbase.util.IAxisRuler). This provides a reference point when scrolling is enabled and the chart is moved such that the chart's own axes are not visible. This feature is for 2D charts only.
If the pop-up menu option was selected during the chart creation/editing, the chart can be modified. The menu is opened by right clicking on the chart and the options there can be selected by highlighting and left clicking on it. Options available for viewing, when enabled, are dynamic data drill-down, changing chart types, axis zooming, and time-series data zooming.
The chart dimension and chart type can be changed by using the pop-up menu and selecting either the 2D/3D option or the Type option.
Please note that Overlay, Box and Dial chart options do not appear if the chart is three-dimensional.
In the case of a large chart whose dimensions exceed that of the viewport (i.e. if a chart is large enough that it cannot be completely seen within window), an option exists to allow for axis zooming. This allows you to move all the axis and zoom in and out of the axis.
This option is only available for two-dimensional charts. Please note that the bubble, dial, pie, polar, radar, scatter, stack area, and vertical box charts do not support this feature.
You can enable this option by opening the pop-up menu and selecting Enable Zoom. You can choose from the zooming in on the x-axis, the y-axis or both.
To zoom in, left click on and drag out the desired area. If only the y-axis zooming is selected, you need not worry about the length or position in the x-axis.
Scrolling is enabled only for axes that have been zoomed. There will be scrollbars visible on the particular axis when axis zooming is enabled. You can left click and drag this scrollbar to shift the viewport of the applet.
Holding down the control key while left clicking will take the applet back to the previous zoom. Please note that only one previous zoom is stored in memory and thus you can only go back one step. To go all the way back to the default x and y scale, press the Home key on your keyboard.
If the chart being shown is a zoom enabled chart, the zoom option will be available from the pop-up menu. Using the zooming option, you can group the category elements into user-defined intervals and aggregate the points in each group. For details on date/time based zooming, see Section 3.14.8.2 - Date/Time Based Zooming. Enabling zoom will allow you to input various zoom options such as lower bound, upper bound (you can also disable the bounds in which case it will go from the first data point to the last), the time scale, and whether you want the x-axis to be linear or not.
You can configure the next drill down by selecting drill down from the pop-up menu. This option is available only if dynamic data drill down is enabled for the chart. After selecting the Drill Down option the in the pop-up menu, you can view the current setting for the next drill down chart. If the Category is None, the next level has not yet been configured. If there are unused columns in the data used to generate the chart, you can select a column for the Category. After the Category has been selected, the Type of the chart in the next level can be set (along with Series and SumBy). The data points can now be left clicked to move down a level and right clicked to move up a level.