In ERES, all reports and charts created in or added to the Organizer are automatically published. By logging into the menu page, users can access and run any reports to which they have privileges in the Organizer. The menu page is included with ERES and deploys without any code.
The menu page can be launched from the ERES start page. Once you've logged in successfully, click the Published Files link.
The menu page can also be accessed directly, by going to the menu page login: Menu_Login.jsp. If you installed ERES with Tomcat the URL to the login is http://machinename:port/ERES/Menu_Login.jsp. This will bring up a page allowing you to login to the menu page directly.
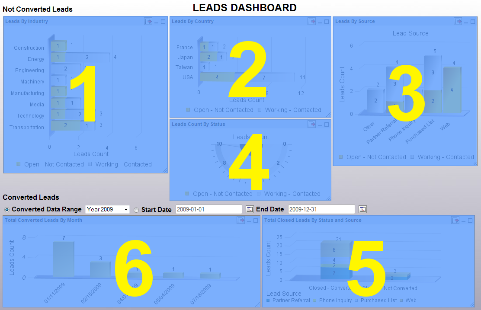
When the menu page first loads it will show a collapsed tree-list of all the reports, charts, dashboards, and other files in the Organizer which you have privileges to see in a tabular format.
Menu Page
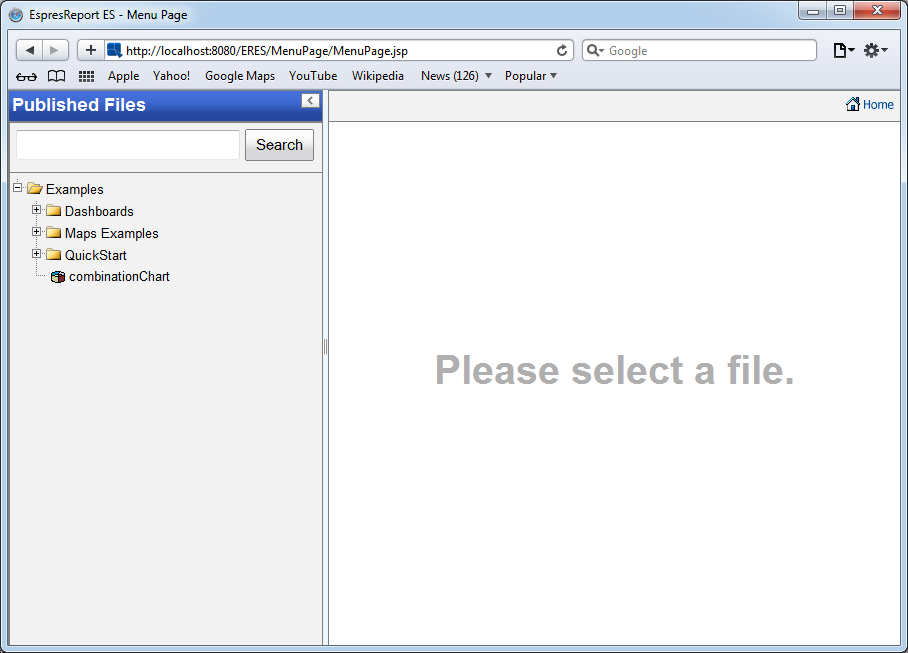
To open a file, expand respective project/folder nodes (in the left-hand tree-list) to locate the file and click on the file name. The file will load in the right-hand DHTML Viewer panel.
You can also search for specific files. To do so, enter the search terms in the dialog in the upper left, and click . The tree-list will re-load showing only the relevant files. To cancel the search filter, click the ![]() Close Search icon next to the search field. Note that the Close Search icon will not be visible if there is no filter applied to the list at the moment.
Close Search icon next to the search field. Note that the Close Search icon will not be visible if there is no filter applied to the list at the moment.
You can hide the left-hand panel by clicking on the ![]() Click to collapse this pane. icon located in the top-right corner of the navigation panel.
Click to collapse this pane. icon located in the top-right corner of the navigation panel.
To close the MenuPage and to return to the ERES start page, click on the ![]() button in the top-right corner of the MenuPage.
button in the top-right corner of the MenuPage.
If you open a report or a chart that was scheduled or archived (i.e. the task was run at least one time, it doesn't matter whether the task has already finished or whether it is still active), the following options will be available.
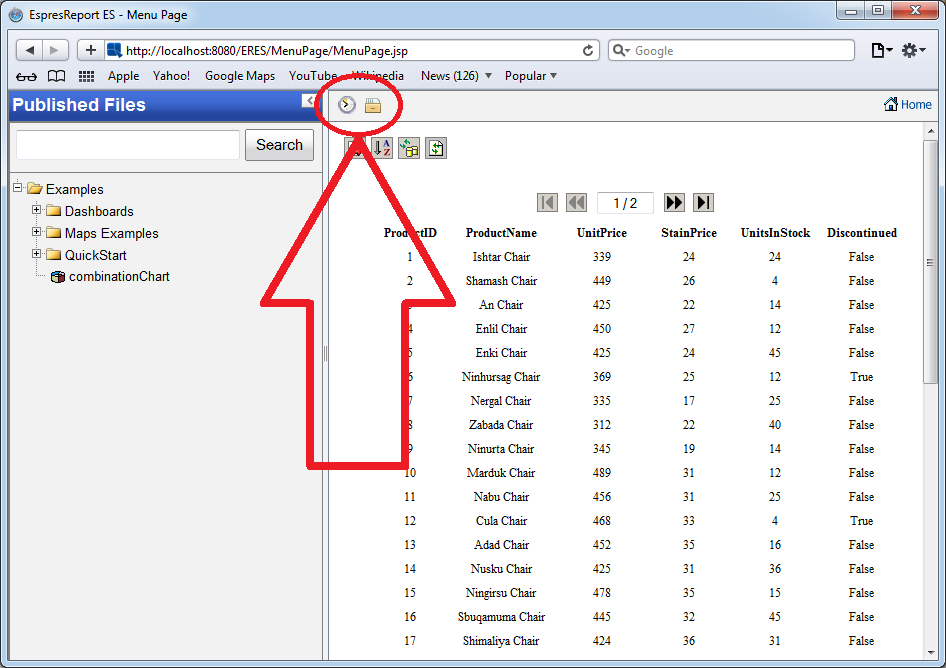
Location of the View Scheduled/Archived version icons
| View Scheduled Report/Chart: This option allow you to view the latest scheduled version for the report or chart with file extensions as 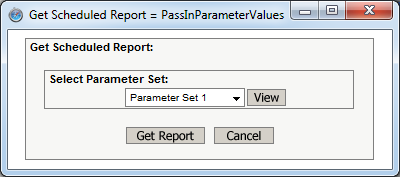 Select Parameter Set Dialog Here you select which parameter set you would like to use to see the latest scheduled version. Parameter sets are defined when the schedule job is created. For more about setting schedules see Section 2.2 - Scheduling & Archiving. You can see which values are included in a parameter set by clicking the button. This will open a new window showing the parameter values.  Parameter Values Dialog Once you've selected the parameter set that you would like to use, click Get Report (or Get Chart) and the scheduled report/chart will open in a new window. If the report or chart contains no parameters, the scheduled version will open directly when you click the button. |
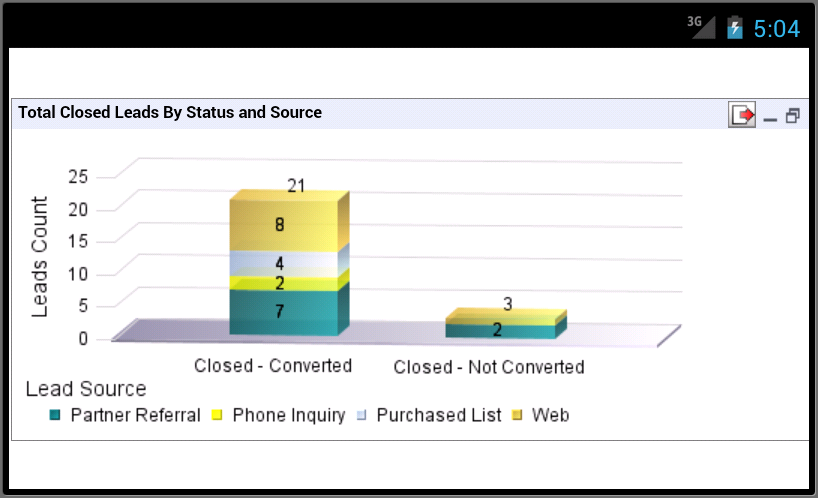
| View Archived Report/Chart: This option allows you to view an archived chart or report. This option is only available if an active archive is defined for the report or chart with file extensions as 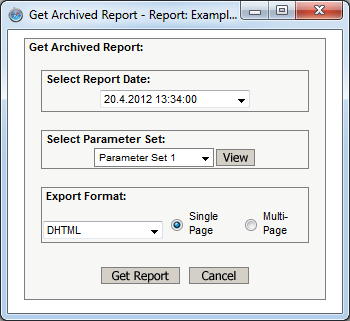 View Archive Dialog The first option allow you to select the version of the report or chart you would like to run. The drop-down list contains dates and times for each version. If the report or chart is parameterized, then the second option will allow you to select a parameter set, in the same manner as for scheduled reports and charts. The last option allow you to select the export format. These options are the same as when running a report or chart. Once you have finished setting options for the report or chart, hit the or button. The exported report or chart will open in a new window. |
If your report contains encrypted data, you need to do two things in order to view the data.
You need to create an XML file that gives the database URL, database driver, name of column to be decrypted, and the function to be applied when the data is being retrieved.
You need to include the ReplaceColumnInfoList option in the command line, i.e.
servercommand.txtbefore you start ERES server.
For more details and an example for viewing encrypted data, please see Section 3.18.1.2 - Querying Encrypted Data.
If you click on a report in the menu page tree-list, the report will open in the DHTML report viewer. This interface is a thin-client component that allows the user to view and interact with the report. In the DHTML report viewer, the first page is shown to the user as soon as it is ready, while the rest of the report continues to be processed on the server side. This means that for larger reports, navigating to a page that is not yet exported will result in a delay. Before a report is finished processing, the tool bar options will not be available, and clicking on any of them will result in a warning message. The main window of the interface provides the user with an HTML view of the report with a small toolbar in the top-left corner of the page. Each of the options on the toolbar will bring up a dialog allowing you to make some changes to the report.
The main window also contains a page navigator that contains first page, previous page, next page, and last page buttons as well as a text box to jump to any specific page number. The text box displays the current page number in the form <Current Page Number> / <Total Page Number>. To jump to a specific page, simply type the page number in the text box and press Enter. You can also enter the value in the same fractional format that is used in the display. For example, to jump to page 7 of a 22 page report, you can enter 7 or 7 / 22.
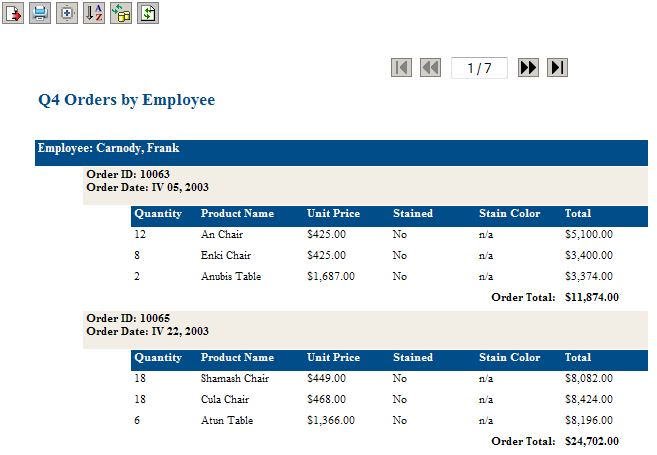
DHTML Viewer Interface
The options in the DHTML report viewer toolbar are as follows:
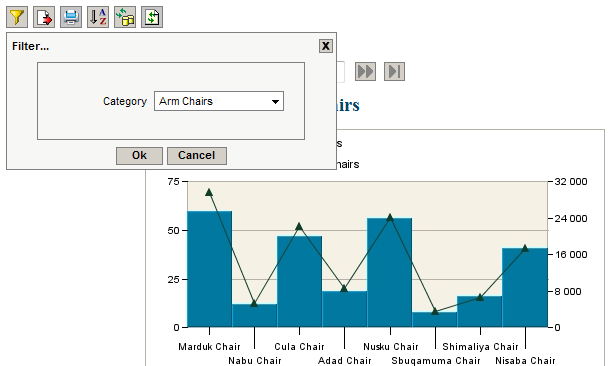
| Filter Report: This option is only available if the report is parameterized. It will bring up a dialog containing all of the parameters defined in the report.  Filter Dialog Select the new values you would like, and click to update the report. For unmapped parameters, there is a validation system that will check the values entered with the expected datatype and alert you if the type does not match. |
| Export Report: This option allow you to export the report in a variety of file formats. It will bring up a dialog prompting you to select export options.  Export Dialog The first option in the dialog allows you to specify in which format you would like to export the report. Available options are HTML, PDF, CSV, Excel (XLS), Excel 2007 (XLSX), DHTML, text, XML and rich text. Other options allow you to set single or multi-page export for HTML, DHTML, and XML exports. For PDF export you can enable encryption. For text export you can select the delimiter to be used, and for XML export you can select whether to export only the report data, or to export an XML description of the report and data. For more information about the export formats, and options, please see Section 3.5.2 - Exporting Reports. Once you have finished specifying options for the exported report click . A new window will open containing the exported report. The toolbar is active on this window allowing you to save the generated file to the local system, or to print the report locally. |
| Print Current Report: This option allow you to print current page of the report on user's local printer, as displayed inside the right-side panel.
|
| Expand and Collapse View: This option allow you to add expand and collapse controls to any grouped report.  Expand and Collapse Dialog The first option in the dialog allow you to turns the control for expanding and collapsing on. Enable Animation allows the grouping to fade in and out as the grouping is expanded and collapsed. Expand To species the initial presentation of the report, i.e., collapsed completely, expanded completely or expanded to a specific group level. Once you have finished specifying options click . The controls will now be added to the report. |
| Change Grouping/Summaries: This option is only available if the report was created using QuickDesigner. It opens a dialog that allow you to edit the report grouping and aggregation.  Grouping Dialog To add or remove grouping, select a column and click the or button. If you select more than one level of grouping you can change the nesting order using the arrow buttons on the right-hand side of the dialog. To set column aggregation, click the button below the column list on the left-hand side. This will open a new dialog allowing you to change the aggregation for the columns in the report.  Aggregation Dialog The top drop-down list contains all the selected columns for the report. The lower list contains all the available aggregation options. To set the aggregation for a column, select it in the upper list, and set the desired aggregation in the lower list. Once you have finished, click and the dialog will close. The new aggregations will be reflected in the column list. |
| Change Column Order/Visibility: This option is only available if the report was created using QuickDesigner. It opens a dialog that allow you to change the column order in the report as well as show/hide columns.  Column Order Dialog The dialog contains a list of all the columns in the report. To change the column order, select a column in the list, and click on the or buttons to change the order. The order from top to bottom in the dialog represents the column order from left to right in the report. To show or hide a report column, check or un-check Visible option at the bottom of the dialg. |
| Change Sorting Options: This option allow you to change the sorting in the report. It will bring up a dialog prompting you to set sorting options.  Sorting Dialog The left-hand side of the dialog contains all the columns in the report. To sort by a column, select it in the left-hand side and click the button. You can control the sort priority, by selecting a sort-by column in the right-hand side, and clicking the or buttons to change its position. You can control the direction of the sort, by selecting a sort-by column in the right-hand side, and clicking the Asc or Desc radio buttons to indicate the direction. |
| Refresh Data: The DHTML Viewer caches the report and therefore when you close and reopen the same report, the data is not updated. This option will refresh the data in the report. |
| Reload Report: When you run a report in the DHTML Viewer, then makes some changes to this report, and then try to open this report again in DHTML Viewer, you'll notice that the report does not reflect the new changes. This is because the DHTML Viewer caches the report to improve performance. To see the changes, use the button to have the DHTML Viewer read the report structure again and also refresh the data. |
When viewing a parameterized report in the DHTML Viewer, the parameters are initially set to their default values. You can then change the parameter value using the icon described above. The DHTML Viewer can also be used to view drill down reports with unmapped parameters. Similar to a regular parameterized report, the drilldown report will display using default values, but you can adjust them by using the icon.
Drilldown with Unmapped Parameter
If you click on a chart in the menu page tree-list, the chart will open in the DHTML chart viewer. This interface is a thin-client component that allows the user to view and interact with the chart. The DHTML chart viewer displays the chart using the default parameter value (if the chart is parameterized). The parameter value can be changed using the toolbar options. The main window of the interface provides the user with an HTML view of the chart with a small toolbar in the top-left corner of the page. Each of the options on the toolbar will bring up a dialog allowing you to modify the chart's look and feel, and navigate through the chart.
The options in the DHTML chart viewer toolbar are as follows:
| Filter Parameter : This option is only available when the chart is parameterized. Clicking on the icon will bring up a dialog that allow you to specify the parameter values for the chart. You can choose/select the values and then click to update the chart. For unmapped parameter, the value is validated against the expected data type and alerts you in case of a mis-match. |
| Export Chart : This option allow you to export the chart to a variety of formats, such as PDF, PNG, GIF, JPEG and SVG. The exported chart is then shown in a new window from where it can be saved to the local system or printed. |
| 3D Display Option : This option is only available when the chart is a three dimensional chart. Three-dimensional charts have several additional options. These options can be accessed by clicking the button in the toolbar. This will open a dialog in a new window. Available options include :
Once you have finished setting the options, click to save the changes. |
| Zoom Option : The Zoom option dialog is only available for a chart with zoom feature enabled. You can modify the zoom properties such as the lower bound, upper bound and zoom scale as well as change the period layout to linear. You then click to apply the new zoom changes. |
| Refresh Data : You can use the refresh data option to fetch the latest data for the chart. |
| Reload Chart : Changes in the chart is not always reflected in the DHTML chart viewer. This is because the DHTML chart viewer caches the chart to improve performance. You can click on the icon to see the changes and to refresh the data also. |
| Back Button : The button appears if you are in a sub-level chart. Clicking the button will take you back to the previous level. |
The DHTML chart viewer also supports drill down. You can drill-down to the next level chart (if the chart is a drill down chart) by clicking on the desired data point.
The DHTML chart viewer also pops up a hintbox that displays the data information/hyperlink information for the specific data point. If a hyperlink is embedded, clicking on the data point will direct the user to the linked page.
If you access ERES main page from a mobile device, a special simplified ERES start page will be displayed.
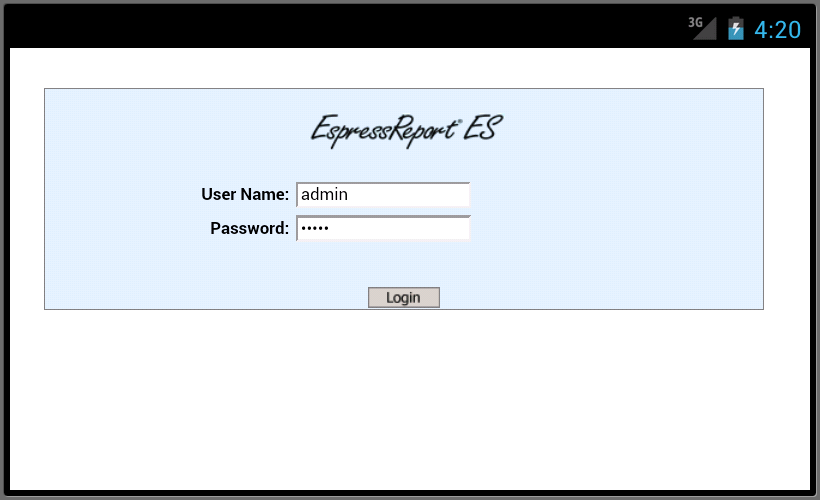
ERES mobile start page
![[Note]](../../../images/note.png) | Note |
|---|---|
The mobile features don't work in so-called PC view, which can be enabled in some mobile web browsers. In PC view, the standard ERES start page and MenuPage will be displayed. |
Enter your user name and password and tap on the button. You will be redirected directly to a special mobile MenuPage which allows you to view reports, charts, maps and dashboards.

Mobile MenuPage
The mobile MenuPage is easy to use - scroll/swipe up or down to locate a template or a dashboard and tap on it's name to open it.
- Mobile Report Viewer
If you open a report from the mobile MenuPage, standard DHTML Viewer will open. To learn more about the DHTML Viewer, see Section 6.1.2.2 - Using the DHTML Report Viewer.
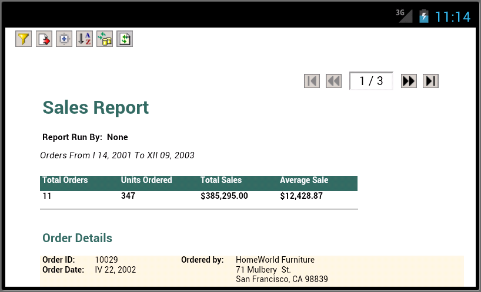
DHTML Viewer
- Mobile Chart and Map Viewer
Chart/map viewer has no control elements.
If the chart/map has some parameters, a parameter prompt will be displayed first. Enter some parameter values and tap on the button to display the chart/map.

Parameter prompt
- Dashboards
If you open a dashboard on a mobile device, you can swipe the dashboard to navigate in it.
However, on smaller devices, navigating through large dashboards may require extensive zooming and scrolling. In such cases, you can maximize a dashboard template to display the dashboard in a more mobile-friendly way.
To maximize a template, click on it's
 icon, or double-tap/pinch on the template.
When navigating in maximized-mode, all dashboard templates will be arranged in a single loop, so you don't have to remember the dashboard layout at all. If you swipe on a maximized template to the left, the next template will be displayed.
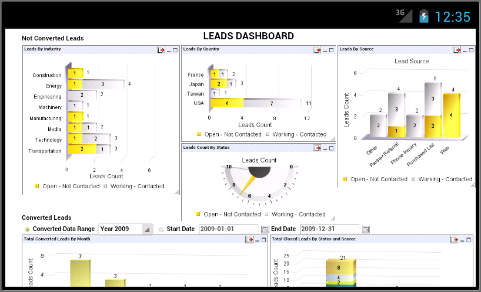
For example: Templates from the following dashboard:
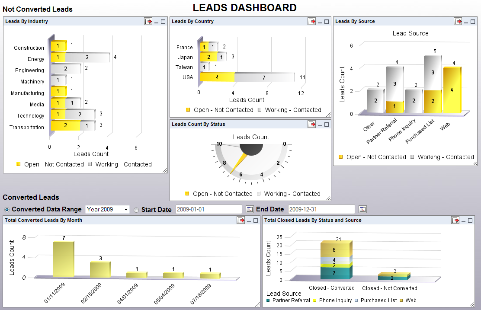
Would be displayed in the following order: