The QuickDesigner is a thin-client ad-hoc reporting interface. It provides users a scaled-down design tool to create queries, charts, and reports. With the QuickDesigner, end users can easily select, filter, and present data without mastering database structures, or reporting features, and all with zero client download.
QuickDesigner can be started from the ERES Start page. If you have logged in as a user with design privileges, then you can follow the QuickDesigner link to begin using QuickDesigner.
QuickDesigner can also be accessed directly, by accessing the login page for QuickDesigner: qDesigner/QD_Login.jsp. If you installed ERES with Tomcat the URL to the login is http://machinename:port/ERES/qDesigner/QD_Login.jsp. This will bring up a page allowing you to login to QuickDesigner directly.
When the QuickDesigner launches the first dialog that appears prompts you to elect to open an existing report or chart, or to create a new one. If you select to create a new report or chart, the next screen that appears prompts you to select the data registry that you would like to use with QuickDesigner. In order to use QuickDesigner a user must have read privileges to one of the registries defined in the Organizer. For more about creating and managing data registries, please see Section 2.4.1 - Managing Data Registries.

Select Data Registry Dialog
Select the registry that you would like to use in the dialog and click the button to continue. The next screen will then display the contents of the selected registry.
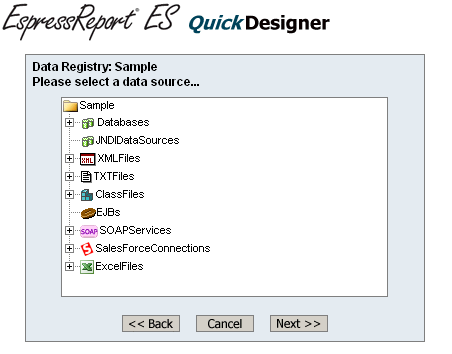
Data Registry Dialog
This dialog shows all of the data sources that have been defined in the registry that the user has access to. A series of radio buttons on the right-hand side of the registry dialog, allow you to select which data source you would like to use. To pick a data source, select the button for that source and click the button.
Unlike Report Designer or Chart Designer where the user can elect to create new data sources or modify existing ones, the only option is to select a data source for the report or chart. Once a data source is selected, you will be taken to a dialog showing the first few records from the source where you can select to create a report or a chart. The only exception to this is for Data Views or Data View Queries. If data sources of this type are selected you will be taken to query interfaces where you can build or modify queries against the View. For more information about QuickDesigner queries, see Section 3.18 - QuickDesigner Queries.
After you have gone to the main QuickDesigner window, you can change the report or chart's data source by clicking on the button on the toolbar. This will take you back to the data registry and allow you to pick a new data source.
If the new data source is a data view or data view query, you will be taken to the query interfaces to build or modify the new query. Otherwise, you will be taken to the report or chart mapping options dialog to re-set the mapping for the new data source.