Dial Chart
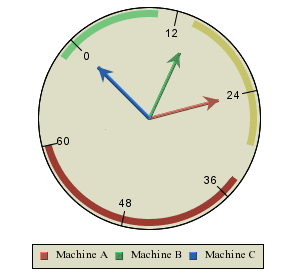
Dial Charts are used to build circular charts (such as temperature gauges, speedometers, and clocks), create dashboards, or balanced scorecard applications. Here the data is represented as a “hand” on a “dial”. You can either use the whole dial (for instance for a clock) or just part of it (a semi- circular chart such as a gasoline gauge). Dial Charts support pop-up labels, drill-down, and user interactions such as rotating the hands or sectors of a dial.
This chart type is available in a two-dimensional form only.
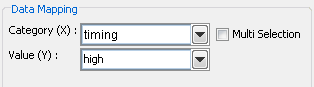
Mapping Options for Dial Charts
The data mapping of a dial chart is similar to a pie chart (detailed in Section 5.8.1 - Data Mapping). However, instead of pie wedges, the categories become dial hands. Also, dial charts do not support data series or secondary values.
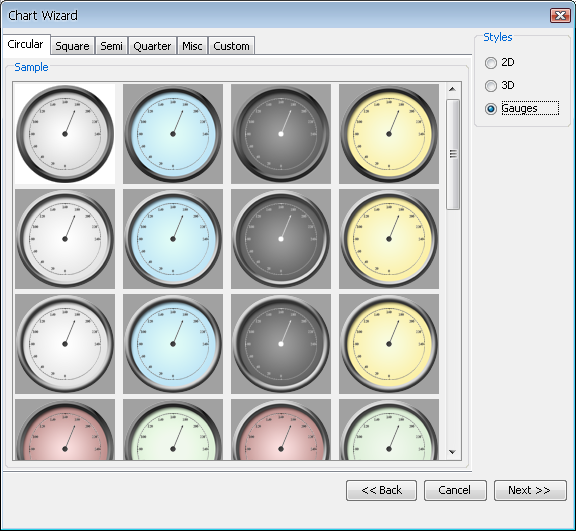
Gauges are special types of dial charts containing a plot background image and/or plot foreground image. To create a new gauge, select the Gauges radio button on the Chart Type Selection dialog.
Selecting a Gauge Template
You can also create your own gauge by creating a template, saving the tpl file in the <EspressChart Install>/gauges/templates/Custom/ folder (please note that the Custom folder is not created automatically by the EspressChart installator so you will have to create it manually in your favorite file manager). To add this template to the Custom tab, you will also need to provide two images, a screenshot of the template placed in <EspressChart Install>/gauges/screenshots/selected/Custom/, and a dimmer version of the same template placed in <EspressChart Install>/gauges/screenshots/unselected/Custom/. An easy way to create the screenshot is to export the template to gif for the regular screenshot and resize it to 100px by 100px. Then change the background to a darker color, export and resize again for the dimmer version.
It is also possible to apply a gauge template onto an existing dial chart. Selecting apply template when the current chart is a dial chart will display the gauge tabs just like when creating a new chart.
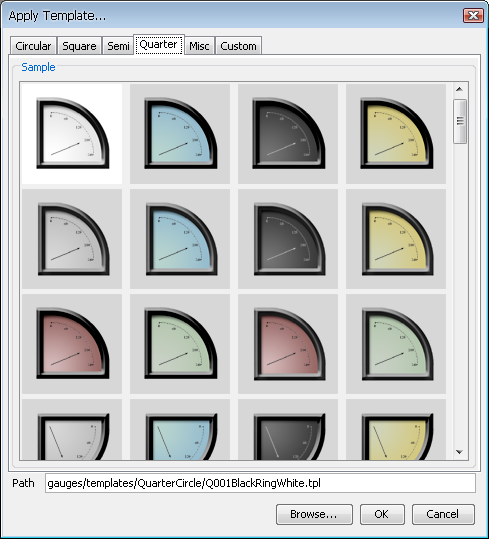
Applying a Gauge Template
For more information regarding the dial background and foreground images, see Section 6.9.2 - Dial Charts.