Overlay Chart
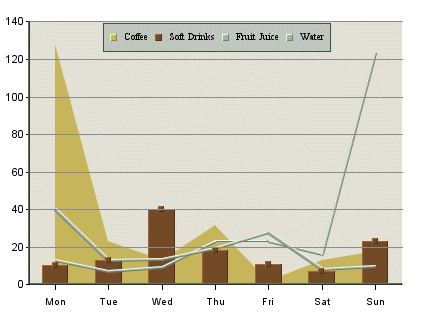
EspressChart supports a special chart type called overlay chart, which allows you to super-impose more than two charts with a common category axis. A different chart can be used to represent each element of a data series. This allows for more freedom while creating the chart and also allows more information to be represented. The chart types supported in an overlay chart are column, area, and line charts. Only two-dimensional charts can be included in an overlay chart.
Mapping Options for Overlay Charts
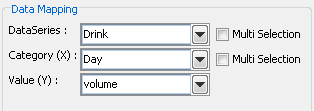
The data mapping for an overlay chart is similar to a column chart (covered in Section 5.2.1 - Data Mapping), except that the overlay chart plots each element in the data series as a separate chart. Please note that the 2nd Value, 2nd Series and Combo options do not apply to overlay charts. Overlay charts do not support secondary values. However, the different series elements can be plotted on different axes. For more about plotting options for overlay charts, see Section 6.9.3 - Overlay Charts.