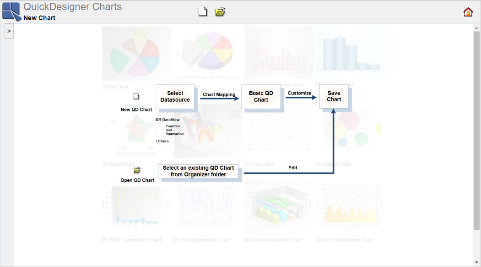
QuickDesigner Charts is a thin-client ad-hoc charting interface. It provides users a scaled-down design tool to create charts. With QuickDesigner Charts, end users can easily select, filter, and present data without mastering database structures, all with zero client download.
For more detailed information about all the chart options available in QuickDesigner Charts, see Section 4.4 - QuickDesigner Charts.
To start QuickDesigner Charts, go to the ERES Start page and click the link labeled QuickDesigner Charts. QuickDesigner Charts should open, and you can create a new chart or open an existing one.
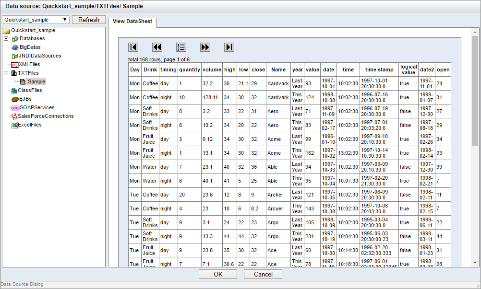
Click the button on the toolbar ![]() . You will be taken to the Data Source Dialog, where you can select a data registry and a data source for a new chart. Select the Quickstart_sample data registry from the top left drop-down list, and then select the
. You will be taken to the Data Source Dialog, where you can select a data registry and a data source for a new chart. Select the Quickstart_sample data registry from the top left drop-down list, and then select the Sample.dat text file data source that you created in Section Q.3.1.4 - Setup a Text Data Source. You can see records of the text file in the View Data Sheet window on the right side of the Data Source Dialog. Click the button to continue.
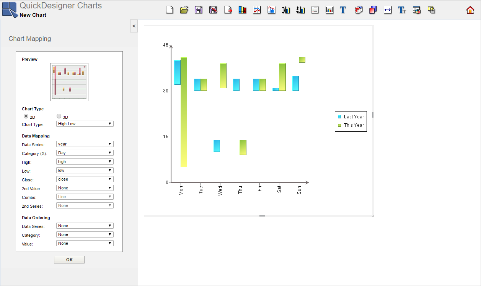
You can see the Chart Mapping dialog that allows you to select the chart type and mapping options. Select to create a 2D High Low chart using the first options in the dialog.
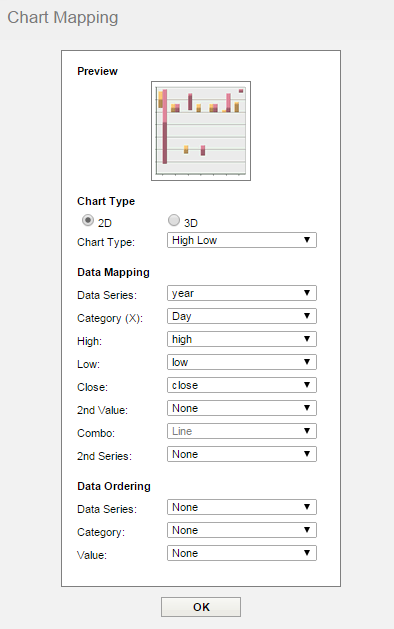
Chart Mapping Dialog
For the mapping options select year as the Data Series, Day as the Category, high as the High, low as the Low, and close as the Close. Click and the chart will open on the right side of QuickDesigner Charts.
Click the button on the toolbar ![]() . This will bring up a dialog allowing you to set the size of the chart canvas. Set the size to be
. This will bring up a dialog allowing you to set the size of the chart canvas. Set the size to be 500 by 400 pixels and click .
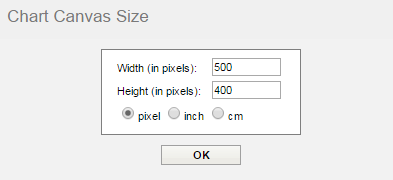
Chart Canvas Size Dialog
Next, click the button on the toolbar ![]() . This will bring up a dialog allowing you to set the font options for the different text elements in the chart. From the drop-down list in the top of the dialog select
. This will bring up a dialog allowing you to set the font options for the different text elements in the chart. From the drop-down list in the top of the dialog select X Axis Labels. Then set the font to be Arial, 8 pt, and Plain.
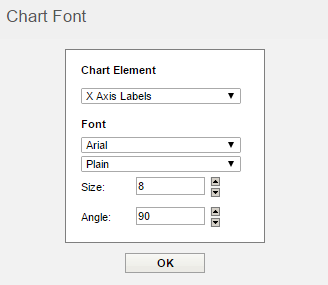
Chart Font Dialog
Now repeat this process for the Y axis labels and the legend text, setting them all to be Arial, 8pt and Plain. Click .
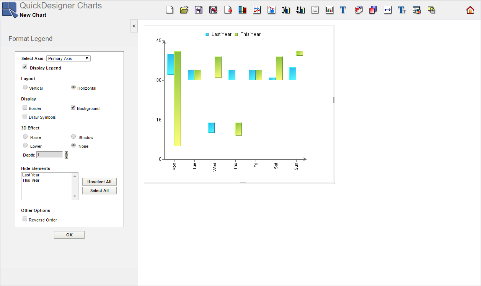
Next, click the button on the toolbar ![]() . This will bring up a dialog allowing you to set display options for the chart legend. Change the Layout option to
. This will bring up a dialog allowing you to set display options for the chart legend. Change the Layout option to Horizontal, uncheck the Border option, and change the 3D Effect option to None. Click to apply the changes.
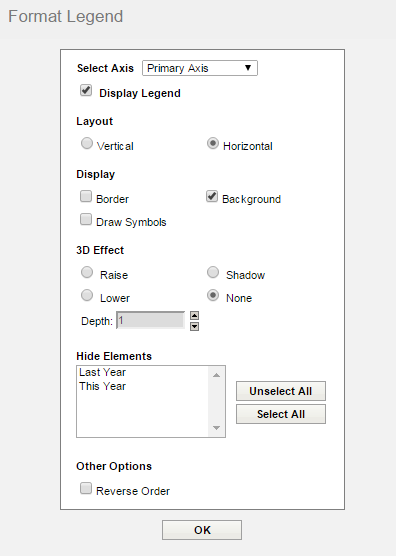
Format Legend Dialog
Now left click on the chart, hold the mouse button down and move the chart to keep the best position. Do the same with the legend. You can also set the plot area size by dragging the sides or dragging the corners of the chart. To do this, mouse over the side or the corner of the chart until you see the arrow. Then left click and drag.
For more detailed information about all the chart formatting options available in QuickDesigner Charts, see Section 4.4.5 - Data Formatting.
Now that you have finished formatting the chart, you can save it back to the Organizer. To save the chart, click the button on the toolbar ![]() . This will bring up a dialog allowing you to specify a name for the chart.
. This will bring up a dialog allowing you to specify a name for the chart.
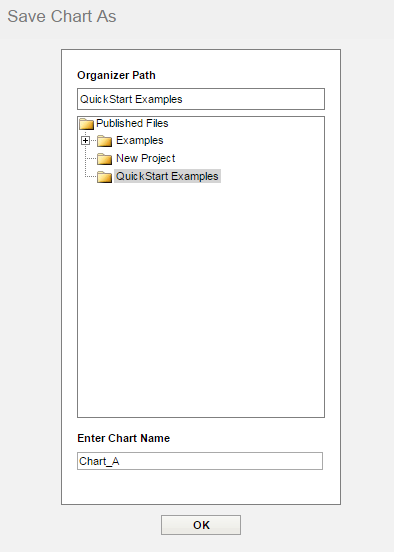
Save Chart Dialog
Select the QuickStart Examples project that you created in Section Q.2.2.2 - Add a Project and enter a name for the chart. Click to save the chart. The window will then give you a message to indicate that the chart was saved successfully. Click to close the dialog.
