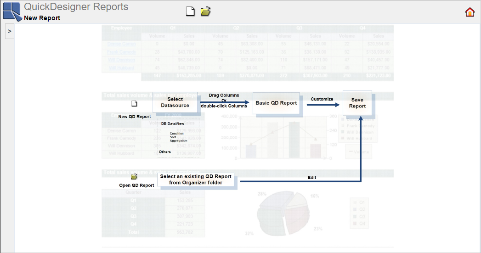
In the previous sections we looked at using Report Designer and Data Source Manager interfaces to query databases and create reports. ERES also provides the QuickDesigner Reports interface which provides a thin-client interface for creating ad hoc queries and reports. In this chapter, we will create a query and a report using QuickDesigner Reports.
To start QuickDesigner Reports, go to the ERES Start page and login using the user created in Section Q.2.1 - Create a User. When you login click the link labeled to launch QuickDesigner Reports.
QuickDesigner Reports allows you to build a report using any data source that you can with Report Designer. However, if you want to modify a data source, you can only query DataViews or modify existing DataView queries using QuickDesigner Reports.
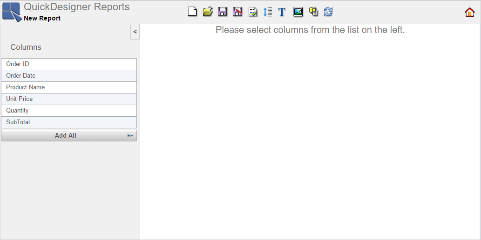
When QuickDesigner Reports opens, there are only two options accessible, to create a new report or open an existing one.
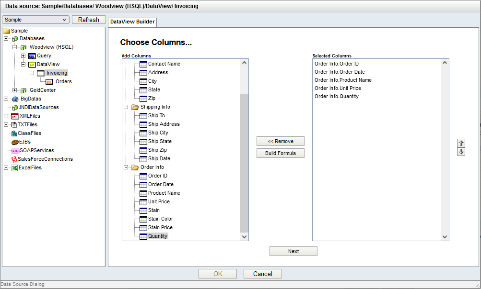
Click the ![]() New button on the toolbar and the Data Source Dialog will open. Select the Quickstart_sample data registry from the left top drop-down list (the data registry you created in Section Q.3.1 - Create a Data Registry). The tab bellow shows all of the defined data sources in the registry. Expand the nodes and select the DataView
New button on the toolbar and the Data Source Dialog will open. Select the Quickstart_sample data registry from the left top drop-down list (the data registry you created in Section Q.3.1 - Create a Data Registry). The tab bellow shows all of the defined data sources in the registry. Expand the nodes and select the DataView Invoicing that you created in Section Q.3.1.3 - Create a Data View. You will see all headings and fields of the view in DataView Builder in the right pane of Data Source Dialog. Add the following fields from the Order Info heading by clicking on them in the left side panel.
Order ID
Order Date
Product Name
Unit Price
Quantity
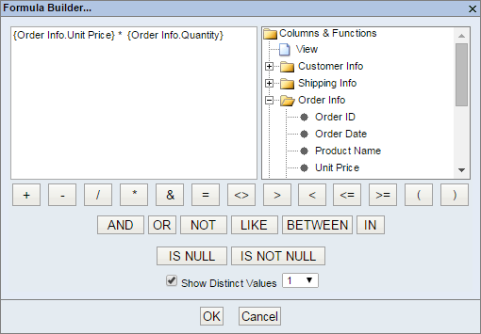
After adding the columns, click the button to build a computed column. This will launch the Formula Builder in a new window.
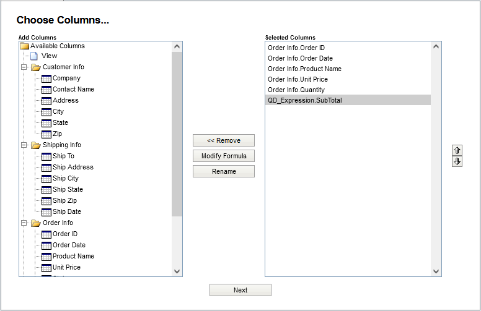
In the Formula Builder, expand the View node in the right-hand side. Then expand the Order Info node. Under this node click the Unit Price entry. The text will be added to the main formula window. Click the . Finally, select the Quantity field. The finished formula should look like this: {Order Info.Unit Price} * {Order Info.Quantity}. Once you have finished, click to add the formula. A new column will be added in the column selection dialog.
To provide an alias for the expression column, select it and click the button. This will bring up a dialog allowing you to specify the alias.
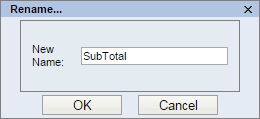
Rename Dialog
Enter SubTotal as an alias for the computed column and click . The computed column is renamed.
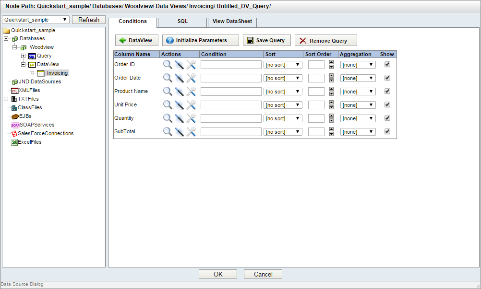
Click the button to submit the column selection. The next dialog that opens allows you to set sorting, grouping, and conditions for the DataView query.
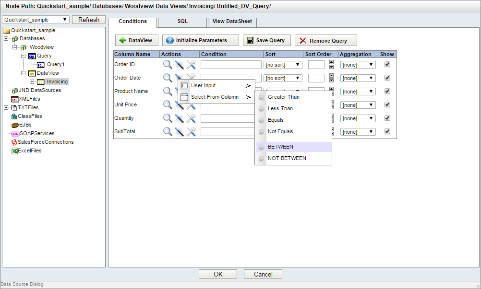
Click the ![]() button for the
button for the Order Date field. Select the Select From Column option and then click the Between operator.
This will open a dialog allowing you to select a date range by which to filter the query.
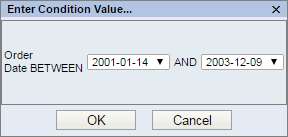
Select Condition Value Dialog
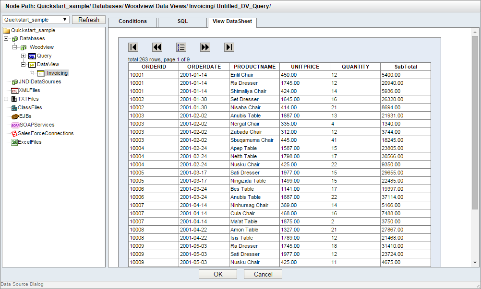
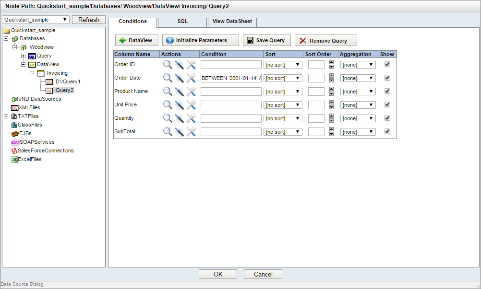
Select the date range that you would like and click . The condition will be added for the Order Date field. Now you can preview the finished query by clicking the tab.
Next, go back to the Conditions tab and click the button to save this DataView query back to the registry. This will bring up a dialog prompting you to select a name for the query.

Save Query Dialog
Enter the name you would like to use for the query and click . The new query appears under DataView node in the left pane of the Data Source Dialog.
Now that you have completed the query, click to close the Data Source Dialog and to open the main page of QuickDesigner Reports.
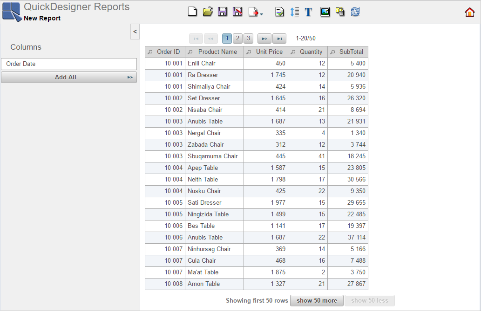
You can insert any column to the report by using a double-click on the column or by dragging it to the report. So, insert columns Order ID, Product Name, Unit Price, Quantity, SubTotal.
Collapse the left Column pane by clicking the ![]() button and adjust the width of columns. To do this, move your mouse over the right side of the column header. You will see a double arrow. Then left click and drag it.
button and adjust the width of columns. To do this, move your mouse over the right side of the column header. You will see a double arrow. Then left click and drag it.
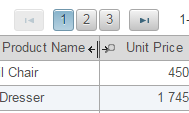
Column Width Setting
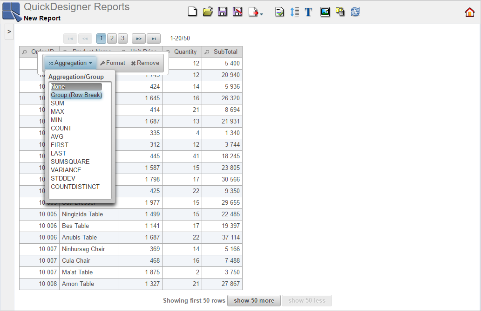
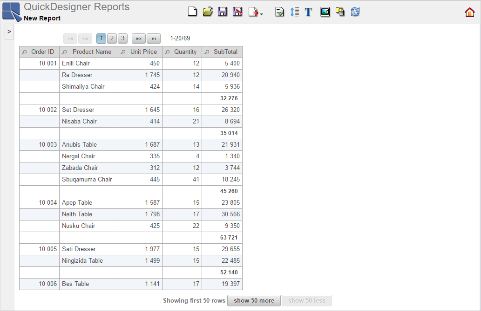
Right click on the Order ID header, select and then Group(Row Break) option.
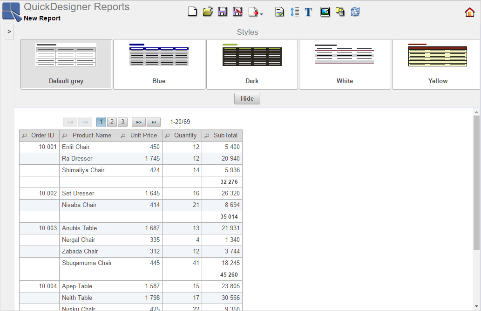
Right click on the SubTotal header, select and then SUM option. Your report should look like this now:
QuickDesigner Reports allows you to change the style of the report by using several predefined styles. Click the ![]() button on the toolbar. The Styles dialog will open above the report.
button on the toolbar. The Styles dialog will open above the report.
Select the style you like, e.g. the Blue style, and close the Styles dialog by clicking button.
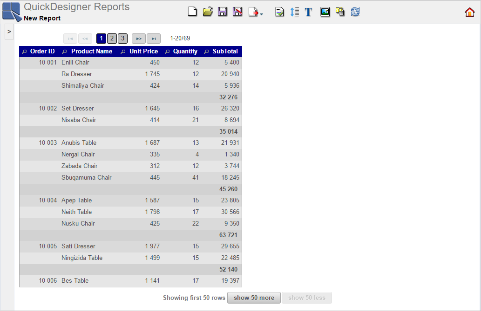
Next, place a pagination under the report. Click ![]() button on the toolbar and Pagination/Scrolling dialog opens. Select Bottom option for Paginator Position and click .
button on the toolbar and Pagination/Scrolling dialog opens. Select Bottom option for Paginator Position and click .
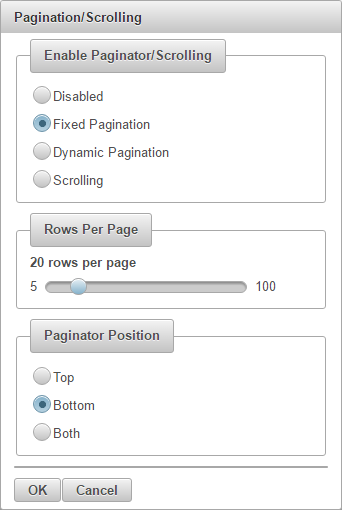
Pagination/Scrolling Dialog
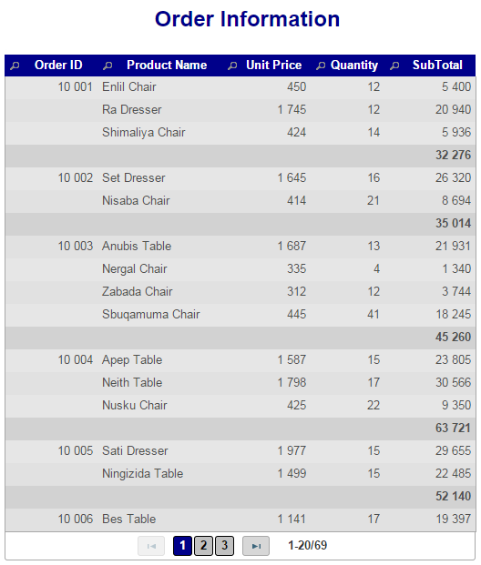
Now, add a report title. Click the ![]() button on the toolbar and the Report Title dialog appears. Type
button on the toolbar and the Report Title dialog appears. Type Order Information as the title and click ![]() button.
button.

Report Title Dialog
The report title appears on the left side of the report by default. Move it to the center of the report. Click on the title, hold the mouse button and move the mouse slightly. Dashed rectangles appear. Move the title to the middle rectangle and release the mouse button.
Your report should look like the report below. For more detail about all the formatting option available in QuickDesigner Reports, see Section 4.3.4 - Format Report Elements.
Now that you have finished formatting, you can save the report you have created back to Organizer so that other users can view it. To save the report, click the button on the toolbar ![]() . This will bring up a dialog allowing you to specify a name for the template.
. This will bring up a dialog allowing you to specify a name for the template.
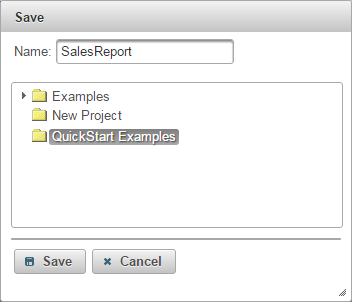
Save Report Dialog
Enter a name for the report, and select the QuickStart Examples project that you created in Section Q.2.2.2 - Add a Project. Click button to save the report.
