An alternative way of presenting your data is by using the EDAB maps feature. EDAB Maps are designed for reporting geographical data from data sources. They fetch geographical data from a data source and mark them on a map. There are two types of maps: Google Maps and SVG Maps. Map Builder is launched by clicking on the Map Builder link on the EDAB Start page.
Before using the Google Maps in EDAB, you will have to register with Google and create your own Google Maps API Key. Visit Google Maps to learn how to sign up and create your key. When registering, pass valid data, especially the domain address you will be running EDAB on. The Google Maps API Key is a case sensitive sequence of characters and numerals, and will be provided to you after registration. After obtaining your own API Key, enter it in the Setting Info under the Administration Console. Note that you have to be logged in as the Admin user to do this. After entering the key, restart EDAB Server.

![[Note]](../../../images/note.png) | Note |
|---|---|
EDAB does not distribute the Google Maps API Key. You have to register to obtain a key. |
Before creating a Google Map, you will need to create a coordinates file. Coordinates files contain coordinates of places that you want to mark on the map. For more details about coordinates, see Section 4.3.3 - Creating Coordinates.
After launching the Map Builder, you will see the following dialog:
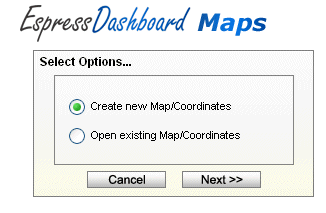
EDAB Map Builder
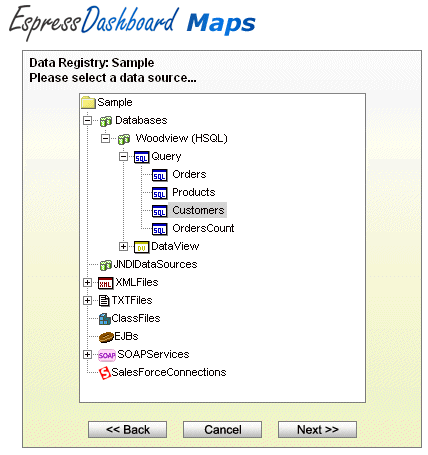
Select Create new Map/Coordinates option and click the button. The data registry selection dialog will appear. Select the Sample data registry and click the button. The data source selection dialog will appear, allowing you to select a datasource for the coordinates file. Click on the TXTFiles option to show all TXT data sources. Select the Customers data source and click the button.
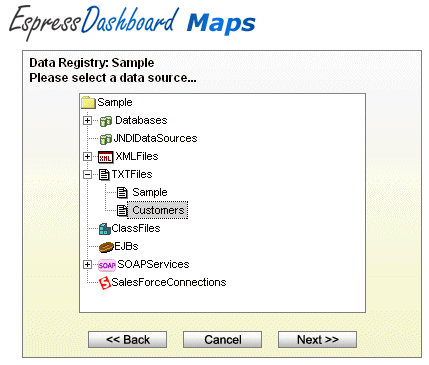
Selecting data source
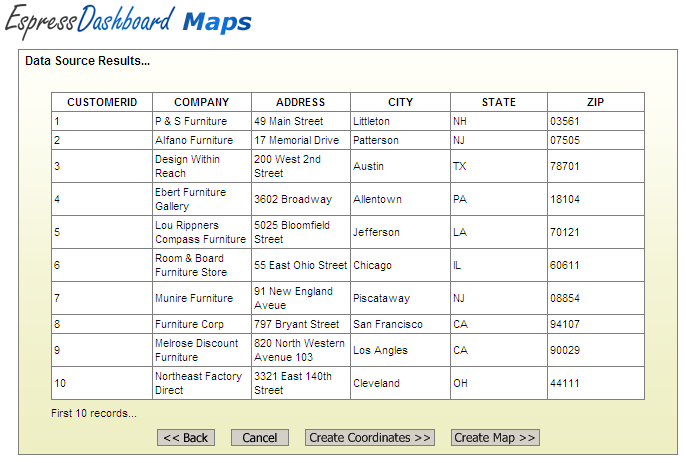
The data source results dialog box will show up. You should be able to see a table displaying first ten records of the previously selected data source. It allows you to check whether you chose the right data source. To create new coordinates file, click on the button.
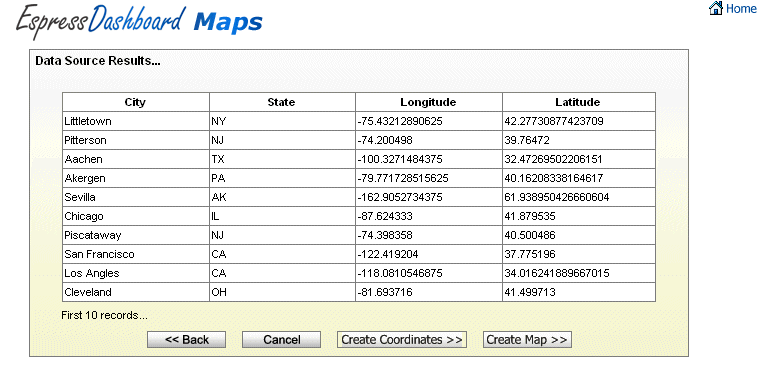
Preview Results
You will be prompted to choose a method of obtaining coordinates from the data source. There are three methods for this purpose. To learn more about how choose the right method, see section Section 4.3.3 - Creating Coordinates. The best method for our Customers data source is to obtain the coordinates directly from the data source, so choose the From data source option and proceed further by clicking the button.
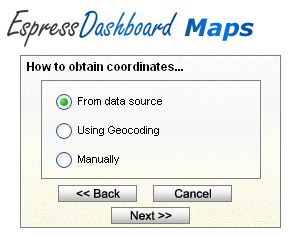
How To Obtain Coordinates
The next step is to select data source fields that contain the coordinates.
| Note |
|---|---|
This step would be different if you chose some other method of obtaining coordinates (all possibilities described in Section 4.3.3 - Creating Coordinates. |
Each Coordinates data record consists of latitude and longitude (obtained automatically or manually) and a Point ID. The Point ID is an identifier of the place (e.g. city name, branch name etc.) and it is loaded from the data source you chose to create Coordinates from. The Point ID can consist of several Point ID fields - each data source column creates one field (except the fields, which contain longitude and latitude). Our data source has four columns City, State, Longitude and Latitude. So the Point ID will consist of two fields - City and State. The upper option is labeled Longitude and the lower option is labeled as Latitude. Just set the upper field to data source field that contains information about longitude (in this case, its the Longitude field) and the lower field to the data source field that contains latitude (Latitude). The following screenshot shows the correctly set dialog:
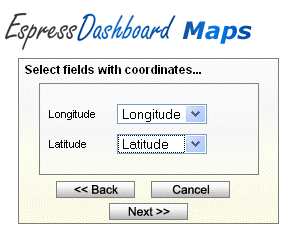
Select Fields With Coordinates
Your dialog should look like the one in the previous screenshot. If it does, click the Next>> button.
Next, the Coordinates designer will show up (see Section 4.3.4 - Operating Coordinates Designer).
Coordinates Designer
When you move the mouse arrow over one of the map markers or over a Point ID Table row, it will highlight the map marker and Point ID Table row that match together. Now you may save the coordinates file. To save, click on the ![]() icon on toolbar.
icon on toolbar.
Type CustomersCoordinates into the Enter File Name text field and change the Organizer Project/Folder drop-down menu to the QuickStart Examples folder created in Section Q.2.2.2 - Add a Project. Click to save the coordinates file.
Now, you can go back to EDAB Start page by clicking on the Home link in the upper right corner. If you want to continue with the next chapter (creating new map), you can click the button on the toolbar instead, so you do not have to quit the Map Builder and start it again. In this case, you can skip the first step in the next chapter.
| Note |
|---|---|
If you have not practiced creating coordinates, please do so. It may be extremely difficult to create a Google Map without the proper coordinates. |
Launch the Map Builder. Select Create new Map/Coordinates option and click .
On this screen, you will be prompted to select a data source. We will use a different data source than we used for the coordinates in previous section. Open the Databases node, then the Woodview (HSQL) and the Query node, and select the Customers query. Click to go to the next step.
Selecting Data Source
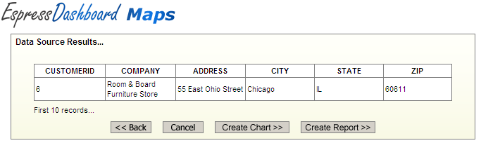
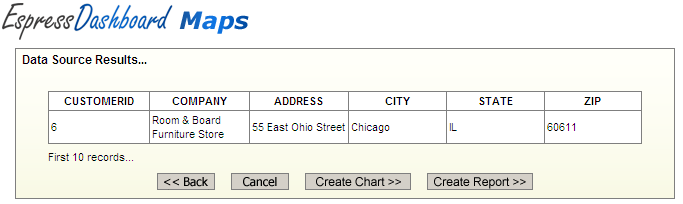
A data source results table showing the first ten records of the data source will appear. Click on the button.
Data Source Results
Select the Google Map option and click . The differences between Google Maps and SVG Maps described in Section 4.1 - Introduction to EDAB Maps.
Now, you will have to select a coordinates file from the Organizer. You will be able to see all projects, folders, and coordinates that were inserted into EDAB Organizer. To select the coordinates file we created in previous section, open the QuickStart Examples project (click on it), then select the CustomersCoordinates coordinates and click .

Selecting coordinates file
Next, you will need to set point mapping. To do this, you need to map at least one field from the EDAB Google map data source to a Point ID field in the coordinates file data source. Both fields should contain the same type of information (for example, city name). But you can map more than one field if that is required to uniquely identify the location on the map (for example, city and state). When determining the map location of the EDAB Google Map data source record, the mapping function automatically searches for the value of the mapped field(s) in EDAB Google Map data source in the mapped field(s) of the coordinates data source. In a nutshell, the coordinates data source contains information about location of data points on the map and EDAB Google map data source contains the data that you want to report on the map. You may read more about point mapping in Section 4.3.5 - Coordinates Mapping.
In this exercise, we will map the State field to the STATE field and the City field to CITY field. Just map the fields and click .

Set Point Mapping
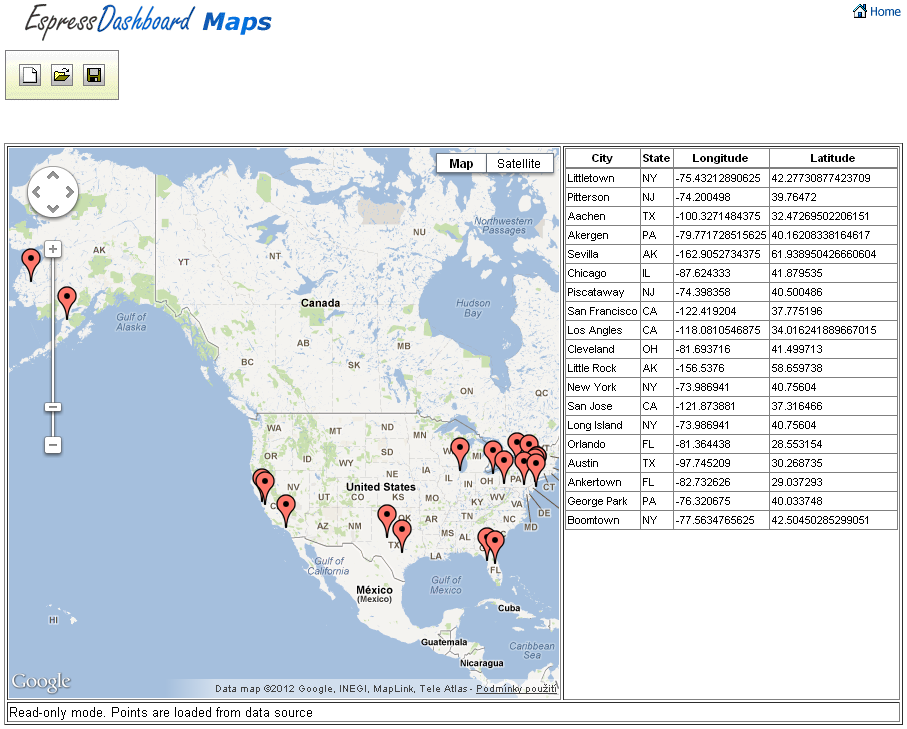
Setting point mapping was the final step of the Maps Wizard. You should be able to see Map Builder toolbar and Google Map with some marker on it (see following screenshot).

Google Map Builder
The Maps Toolbar allows you to configure the Google Map and the map below it shows preview of the Google Map. You can immediately see results of all changes you make on the Google Map (visit Google Maps Help Center to learn how to operate the map).
Save the map by clicking on the ![]() icon on the toolbar. Type
icon on the toolbar. Type CustomersGoogleMap into the file name textfield. Set the Organizer Project/Folder to the QuickStart Examples folder created in Section Q.2.2.2 - Add a Project.
Tooltips show a brief report for a particular map marker. When the tooltips are enabled, each marker on the Google Map has its own tooltip. After setting the Tooltip Template (report or chart) for the Google Map, upon mouse over any map marker, the tooltip bubble will appear, displaying data relevant to the particular marker. Detailed information about tooltips may be found in Section 4.3.6.1 - Google Maps Tooltips.
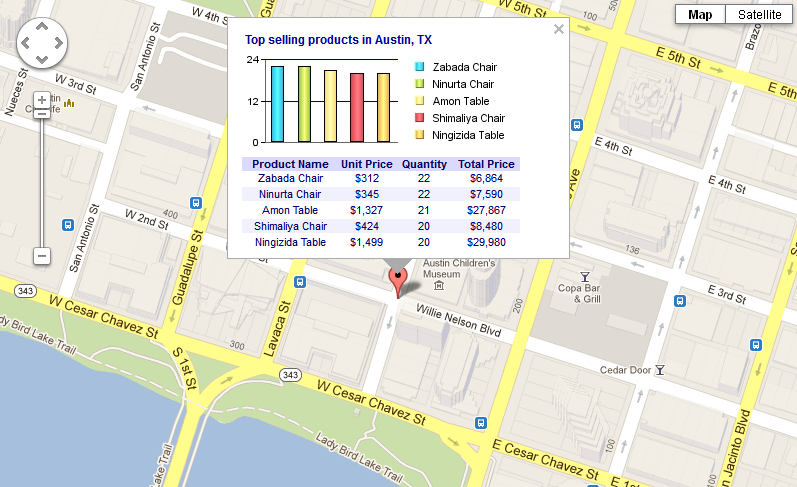
Example: Google Map with Tooltip
Let's configure the tooltips for our CustomersGoogleMap that we created in the previous QuickStart section. Note that if you haven not closed Map Builder and you are still viewing the Google Map, you can skip steps one and two.
Open the EDAB Startup page and launch Map Builder. Select Open existing Map/Coordinates option and click button.

Map Builder - Select Options
Open the QuickStart Examples project, then select the CustomersGoogleMap map and click button.

Open Map/Coordinates from Organizer
Click on the
 icon on the toolbar. You can create new tooltip template or select an existing one from the Organizer. The other two options are disabled until you set some tooltip template. When you choose to select new template, QuickDesigner will launch. For now, we will just make a very simple report in the QuickDesigner. Visit QuickStart Section Q.5 - QuickDesigner, or the user's guide Section 3.7 - Introduction to QuickDesigner for information about how to use QuickDesigner.
Select the Create new template and click button.

Tooltip Template Options
The data source results dialog will open. Click on the button and then click on the button. The main window of the QuickDesigner will then open.
Data Source Results
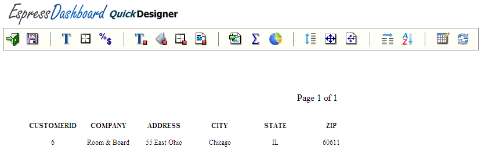
Quick Designer Window
Click on the
 icon on the quick designer toolbar. Enter some report name (for example:
 CustomersTooltip). Select an Organizer project or folder. Click to save the report.
Save Report Dialog
Go back to the QuickDesigner window and click on the
 icon on the toolbar.
Note If you close the QuickDesigner window by clicking on the X icon in upper right corner, the report will NOT be set as the tooltip template. Use the
icon unless you want to cancel creating the tooltip template.Move the mouse arrow over some map marker and a tooltip bubble will appear. As you can see, the bubble has inconvenient dimensions for your report. To adjust the bubble dimensions, click on the
 icon on the toolbar. Set width to 350 and height to 60 and click . Close the currently open tooltip bubble (if any) and move mouse arrow over some marker. The tooltip should look better now.
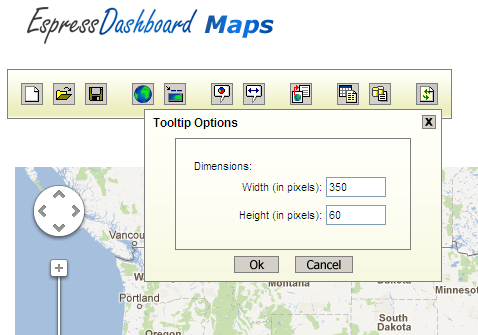
Tooltip Options

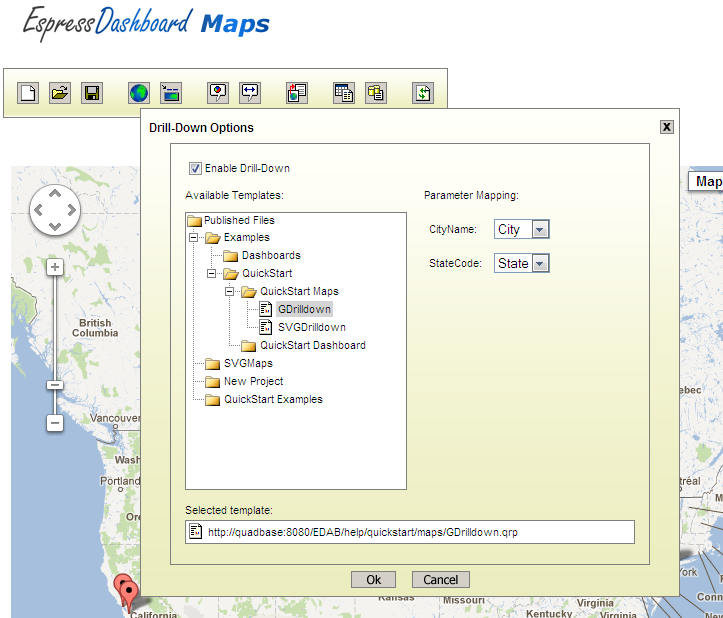
Click on the ![]() icon on the toolbar. Select the Enable Drill-Down option. The Available Templates treeview will open, showing all projects, folders and parameterized reports, charts and maps inserted the Organizer. Open the Examples project, then open the QuickStart and QuickStart Maps folder. Select the GDrilldown report. This report has two parameters: CityName and StateCode. You have to select the Google map database fields containing corresponding data. In this case, map the CityName parameter to the City field and the StateCode parameter to the State field. Click . The drill-downs are configured now. Click on a map marker and the report will open in a new window. More info in Section 4.3.6.2 - Google Maps Drill-Downs.
icon on the toolbar. Select the Enable Drill-Down option. The Available Templates treeview will open, showing all projects, folders and parameterized reports, charts and maps inserted the Organizer. Open the Examples project, then open the QuickStart and QuickStart Maps folder. Select the GDrilldown report. This report has two parameters: CityName and StateCode. You have to select the Google map database fields containing corresponding data. In this case, map the CityName parameter to the City field and the StateCode parameter to the State field. Click . The drill-downs are configured now. Click on a map marker and the report will open in a new window. More info in Section 4.3.6.2 - Google Maps Drill-Downs.
Drill-Down Options
Launch Map Builder. Select Create new Map/Coordinates and click .
In this exercise, we will be selecting a data source for the SVG map. All data sources added to the Organizer will be available. Open the Databases node and select the Woodview (HSQL) database. Open the Query node and select the OrdersCount query. Click .
The data source results will show up. SVG Maps do not use any coordinates files, so just click Create Map>>.
In the Select Map Type dialog, select the SVG Map option and click .
You will be prompted to select a Map Image. Map Images are SVG image files with data structures containing geographic data (see Section 4.4 - SVG Maps for more information about required image format), and must be inserted into the Organizer before they can be used.
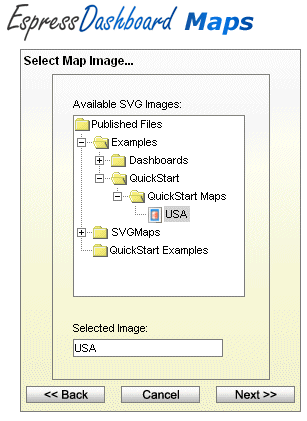
Select Map Image
The Select Map Image dialog contains a tree showing all Projects, Folders, and SVG images inserted in the Organizer. Open the Examples project, then the QuickStart and the QuickStart Maps folder. You should be able to see the SVG image named USA in the QuickStart Maps folder. Select it and click .
You will now be able to set the connection between the data source and the SVG image. This is done by assigning a data source field to the SVG map Area IDs (see Section 4.4.2 - Area ID Mapping to learn more about area ID mapping). In this case, we have a map of the USA with state name abbreviations in its Area Ids. So we want to assign a field containing the same type of data, which is the SHIPSTATE field. Set the Available columns drop-down menu to SHIPSTATE and click Next>> to finish the Wizard.

Select column with Area IDs
SVG Map Builder will open (see following screenshot).
SVG Map Builder
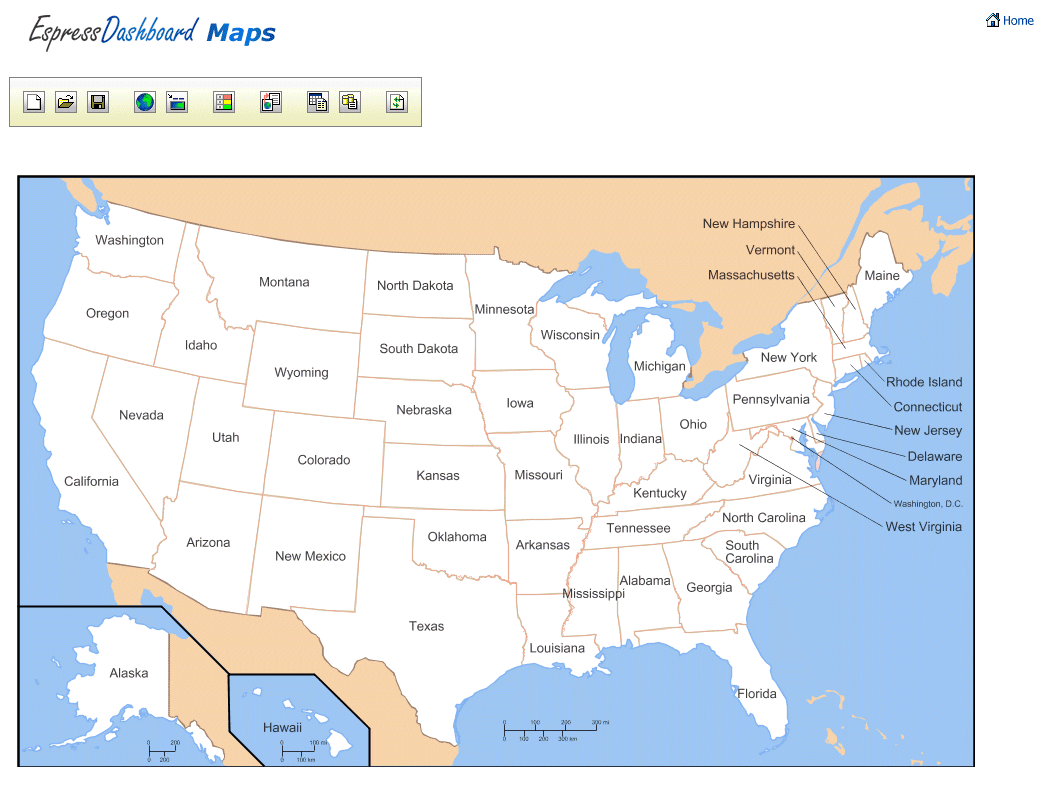
As you can see, right now we have only the basic map with no data highlighted. There are two ways of adding data to the SVG Map: Thresholds and Drilldowns.
Thresholds allow you to configure rules for coloring map areas according to its value in a particular data source field (see Section 4.4.4 - Setting Thresholds).
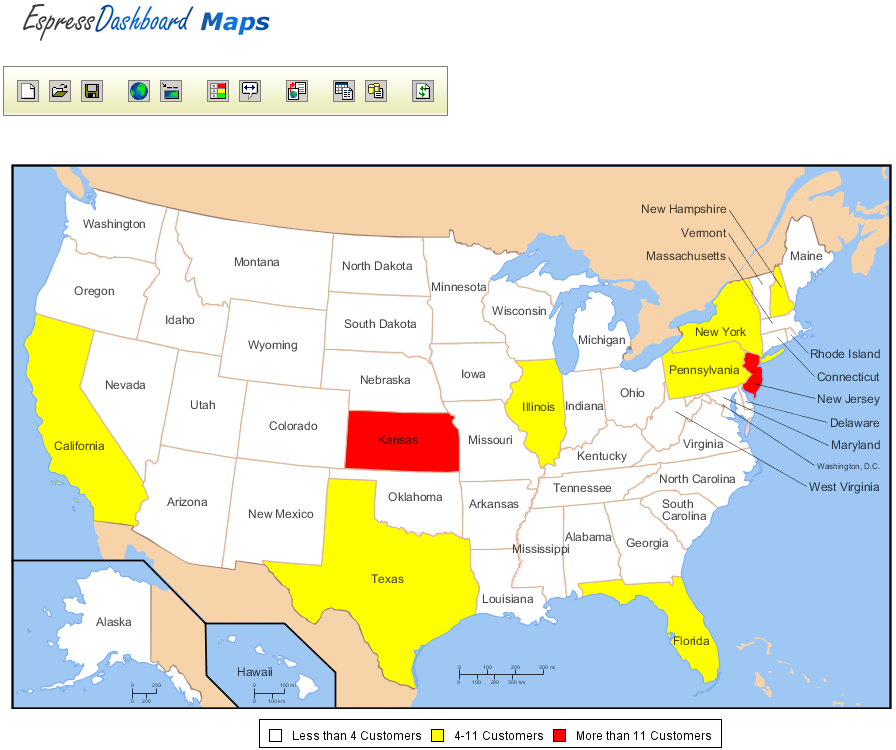
Example: SVG Map with thresholds
To set thresholds, click on the ![]() icon on the toolbar. First of all, you have to select a data source column containing numerical data, you want to report. We will use a column labeled as ORDERSCOUNT, which holds information about number of orders made in a particular state.
icon on the toolbar. First of all, you have to select a data source column containing numerical data, you want to report. We will use a column labeled as ORDERSCOUNT, which holds information about number of orders made in a particular state.
Next, you can add some threshold value(s) in actual values, or percentage unit. We will use actual values for our example. Click on the ![]() icon next to the blank field labeled as Color. You will be prompted to enter threshold value, which can be done two ways – you can type it manually into the textfield or you can select the value from the drop-down menu. (There are three ways to enter threshold values for percentage units. The third way is to enter a number of intervals.) Select the value 4.0 from the drop-down menu and confirm the dialog by clicking . Click on the
icon next to the blank field labeled as Color. You will be prompted to enter threshold value, which can be done two ways – you can type it manually into the textfield or you can select the value from the drop-down menu. (There are three ways to enter threshold values for percentage units. The third way is to enter a number of intervals.) Select the value 4.0 from the drop-down menu and confirm the dialog by clicking . Click on the ![]() icon once again, and choose the value 11.0 from the drop-down menu and click . EDAB has automatically set the ranges between values you added. You can set color for each of the intervals. Click on the white color field next to the 4-11 range. Click on some yellow field in the swatches color table and click . Color of the 4-11 range has changed to yellow. Click on the color field next to the 11 range, choose a red color, and click . The Set Thresholds dialog should look like the one on the following screenshot.
icon once again, and choose the value 11.0 from the drop-down menu and click . EDAB has automatically set the ranges between values you added. You can set color for each of the intervals. Click on the white color field next to the 4-11 range. Click on some yellow field in the swatches color table and click . Color of the 4-11 range has changed to yellow. Click on the color field next to the 11 range, choose a red color, and click . The Set Thresholds dialog should look like the one on the following screenshot.

Set Thresholds - choosing color
Confirm the dialog by the button. Areas of some states will be filled with the colors you previously set. Without a legend, it can be unclear what the colors mean. So let's create one. Click on the ![]() icon again. Select the Enable legend option. The Thresholds table has changed. It has one more column now labeled as legend. You should be able to write into the legend field. Fill in the column according to the following screenshot:
icon again. Select the Enable legend option. The Thresholds table has changed. It has one more column now labeled as legend. You should be able to write into the legend field. Fill in the column according to the following screenshot:

Set Thresholds - Legend
Set the Legend layout drop-down menu to Horizontal and set the Legend position to Bottom. Click .
Click on the ![]() icon on the toolbar. Select the Enable Drill-Down option. Organizer structure will show up in Available Templates treeview. You will be able to see only folders and parameterized reports, charts, and maps inserted into Organizer. Open the Examples/QuickStart/QuickStart Maps folder and select the SVGDrilldown report. Click .
icon on the toolbar. Select the Enable Drill-Down option. Organizer structure will show up in Available Templates treeview. You will be able to see only folders and parameterized reports, charts, and maps inserted into Organizer. Open the Examples/QuickStart/QuickStart Maps folder and select the SVGDrilldown report. Click .
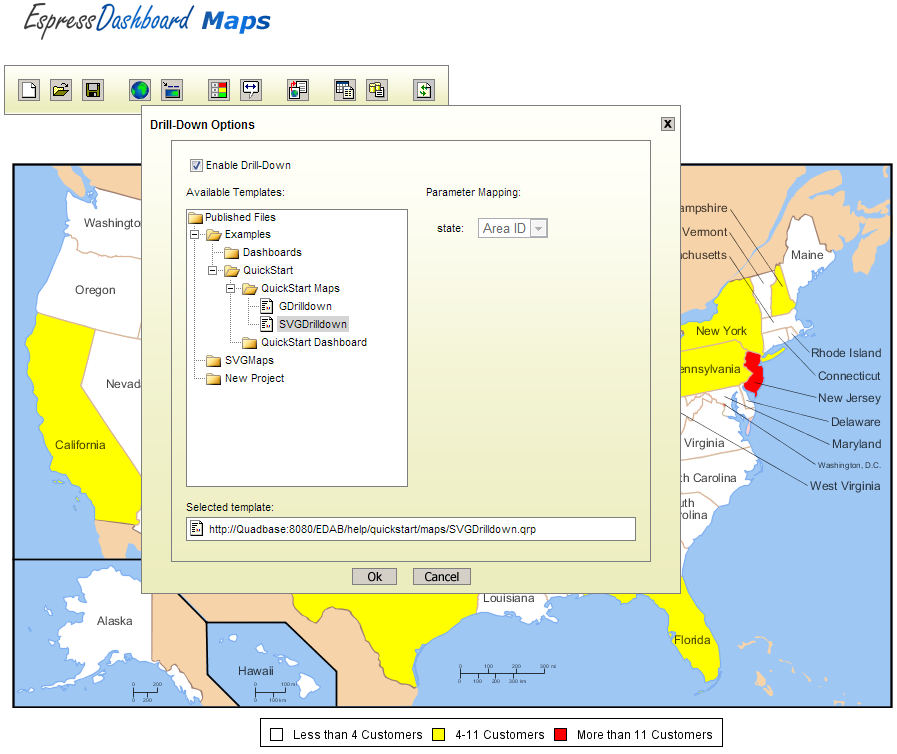
Drill-Down Options
When you click on a colored state area, a drill-down report should open in a new window.
To save the SVG Map, click on the Save icon on the toolbar. Type OrdersSVGMap into the file name textfield and select the QuickStart Examples folder from the Organizer Project/Folder drop-down menu.