Often reports are used to display large amounts of data. However, with large data sets (particularly if the data is fairly detailed) displaying everything in one report is not the clearest way to present the information. One solution to this problem is to create a top-level report that displays only summarized data, and allow users to click through to see underlying data. This is the concept of drill-downs.
In EspressReport, users can easily display data in this manner. Links can be placed on column fields in the primary (top-level) report to secondary (sub-level) reports. The sub-level reports use parameterized queries that accept the value from the primary report as the input. Hence, sub-level reports will only display data related to the particular value on which the user has clicked.
For example, say you are designing a report to show sales data for an entire year. Rather than creating a report that displays the entire year's worth of data, you could design a top-level report that shows aggregated data by month.
| Month | Units Sold | Total Sales |
|---|---|---|
| January | 5 | $10,224.12 |
| February | 4 | $12,286.14 |
| March | 6 | $14,415.16 |
| April | 5 | $12,316.11 |
| May | 2 | $9,482.64 |
| June | 3 | $10,116.12 |
| July | 7 | $17,624.18 |
| August | 5 | $10,361.54 |
| September | 4 | $10,116.82 |
| October | 3 | $8,612.41 |
| November | 5 | $10,552.24 |
| December | 11 | $22,614.89 |
Users viewing the report could then drill-down to see more data for each month. In this case, say the user clicks on March. They would then be taken to an underlying report that offers detailed sales information for that month.
| Sales Data For March 2001 | ||||
|---|---|---|---|---|
| Order # | Customer | Product | Quantity | Total |
| 10042 | Allied Furniture Emporium | Chair | 2 | $6,425.16 |
| 10051 | Furniture World | Table | 1 | $3,114.12 |
| Dresser | 1 | $2,116.83 | ||
| 10068 | Domus Home & Garden | Chair | 1 | $800.65 |
| Dresser | 1 | $1,958.40 | ||
| Total: | 6 | $14,415.16 |
From this report, another layer of drill-down can be added, allowing users to see more detailed customer information. In this case, say the user clicks on Allied Furniture Emporium. They would be taken to a third report that shows more information about the customer.
| Customer Information | ||
|---|---|---|
| Address: | ||
| Company: | Allied Furniture Emporium | 384 Broad St. Littletown, NY 18322 |
| Contact Name: | Matilda Gladwaller | |
| Order History: | ||
| Year | Orders | Total Sales |
| 1999 | 14 | $52,614.18 |
| 2000 | 18 | $68,115.89 |
| 2001 | 12 | $38,812.12 |
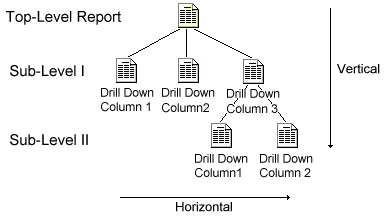
Using drill-down in this manner allows large amounts of information to be presented in a way that is easy to understand and navigate. EspressReport allows horizontal and vertical layers of drill-down. This means that different columns in that same report can have drill-down (horizontal), or that sub-level reports can have subsequent drill-down reports (vertical). Users can also add drill-down layers to sub-reports.
Within the Report Designer, drill-down is controlled from the Drill-Down menu. Selecting the Navigate option from this menu brings up the Navigation window. From this window you can add and edit drill-down reports.
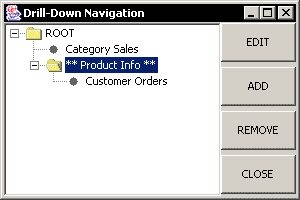
Drill-Down Navigation Dialog
The left-hand side of the Navigation window displays the hierarchy of drill-down reports (see the above diagram). The ROOT is the top-level report. The level that you are currently editing is marked with “**”. To edit a different report, select it and click the button on the right-hand side. That report will then open in the Designer, allowing it to be customized. Reports can also be removed by selecting the report and then clicking the button.
The first step in creating a drill-down report is to create the top-level report. Because drill- down relies on relationships between data sets, only reports that use parameterized queries, XML queries, or class files can be used for drill-down layers. When designing the top-level report, bear in mind that at least one of the columns will be passed as a parameter to any sub-level reports. After you have finished designing the top-level report, go to the Drill-Down menu and select Navigate. The navigation window will open. Select the report under which you would like to add the drill-down layer (if the report has no drill-down, then only the ROOT node will be visible), and click . If you are adding drill-down to a sub-report, first go to the sub-report tab and then load the navigation dialog.
You will then be prompted to create a new report, or use an existing report for the drill-down layer. You can use any existing report; however any report for a drill-down layer must have a parameterized query or class file as the data source. If the existing report contains drill-down levels of its own, all drill-down levels will be imported as well. If you select to create a new report, the Report Wizard will open, allowing you to select a data source, report type, and column mapping.
The next step is to map the columns in the top-level report, to the parameter in the sub-level report. You will be prompted to do this when you select an existing report for the drill-down layer, or when you select the data source for a new report for the drill-down layer. In either case, a dialog will appear prompting you to map the columns.

Parameter-Column Mapping Window
The options that are available in the drop-down menu are based on data type. For example, if your parameterized query takes a string as a parameter, only columns containing string data can be mapped. If there are mulitple parameters for the sub-level query, there will also be the option None. This will allow you to create unmapped drill-down reports. For more information, see Section 1.10.5 - Unmapped Drill-Down. Once you have specified the drill-down mapping, you will be prompted to specify a name for the sub-level report. Now the sub-level report will open in the Design window, allowing you to format and customize it.
By default a link will be placed on the column in the top-level report which is mapped to the sub-level report. Instead of using the default link, you can place the link on a different column, or multiple columns using the Drill-Down Link option from the Drill- Down menu.
To add or remove a drill-down link from a report column, first make sure that you are currently editing the correct template (top or higher level). Then select a column field and select Drill-Down Link from the Drill-Down menu. This will bring-up a drop-down list allowing you to select which sub-level report you would like to link to. To remove a drill-down link, select the blank option at the top of the drop-down list.
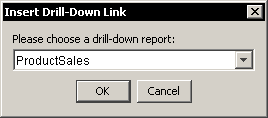
Drill Down Link Dialog
In addition to placing links on a column, you can also set drill-down links on a chart. With this feature, users can click on the data point in a chart and traverse to the next level of drill-down. To set a drill-down link on a chart, select the chart object in the Report Designer, and select Drill-Down Link from the Drill-Down menu. Next, select the sub-level report just as you would for a column.
When you set a drill-down link in the chart depending on the elements in the chart and the number of parameters in the sub-level report, the category, data series, and/or sum by value for the data point that is selected are passed as the parameter value to the sub-level report. In order for this feature to function correctly, the chart will need to use the same data source as the report. The chart should also have the categories mapped to the column that was selected to match the parameter in the sub-level report. For more information about column mapping in charts, please see Section 3.2.2 - Basic Data Mapping and Section 3.4 - Chart Types and Data Mapping.
![[Note]](../../../images/note.png) | Note |
|---|---|
You can setup linking from any chart type; however, not all chart types will work when exported to PDF. Only two-dimensional bar, column, stack bar, stack column, and 100% column charts will generate links in PDF. The PDF export only supports rectangular image maps. |
In addition to drilling on one field at a time, EspressReport supports the concept of multi-value drill-down. Using this feature, you can drill into several different values from a top-level report at once.
For example say you have a report detailing sales information for 100 different customers. Using the multi-value drill-down, users could select the customers that most interest them and drill into their records at once instead of looking at each customer individually.
Adding layers of multi-value drill down to a report is almost exactly the same as adding regular drill-down layers. The only difference is in the query in the lower-level report. To create a multi-value drill down layer, the lower-level report must have a multi-value parameter in its query that is mapped to a column in the higher-level report.
Using the previous example, say the query for the lower level has a multi-value parameter for a customer id - something like Where Customers.CustomerID IN (:CustID). If the CustID parameter is mapped to the Customer ID column in the top-level report, this will automatically create a multi-value drill-down layer. For more information about multi-value parameters, see Section 1.3.2.2.2.1 - Multi-Value Parameters. If you do not wish to create a multi-value drill down layer, simply use a single value parameter in the lower-level report.
![[Note]](../../../images/note.png) | Note |
|---|---|
You can have only one report per level when using multi-value drill-down. It does not support linking different columns from the same report to different reports. |
You can place column links in multi-value drill-down reports; however, a dialog or form is used to allow users to select multiple column values and drill to the next level. For more on this, please see Section 1.10.4 - Viewing Drill-Down Reports.
EspressReport provides a special implementation of the drill-down features when the top level report is a crosstab report. Using the crosstab drill-down features, users can click on a cell in the crosstab matrix and drill into information for that particular row or column. For example, assume you have the following report showing sales volume by product and region.
Using standard drill-down configuration, if a user clicks on one of the hyperlinked cells, only the values from that row could be passed to the lower-level report. However, with crosstab drill-down, the column break and row break values for that cell are passed to the lower-level report. Therefore, if the user clicks on the cell value 144, the values "Chair" and "East" would be passed to the parameters in the lower-level report.
When you select to add a drill-down layer to a crosstab report, you will be prompted whether you would like to create a standard (column linking) drill-down presentation or use crosstab drill-down.
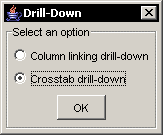
Crosstab Drill-Down Options
If you select to use crosstab drill-down, then the setup will continue just as it would for any other drill-down presentation. The only difference comes with parameter mapping. Instead of mapping parameters from the lower level report to columns in the main report, they are mapped to the row break and column break values for the top-level report.
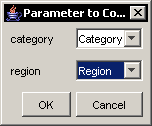
Parameter-Column Mapping for Crosstab Drill-Down
Once you have added the drill-down layer, the cells (column break values) in the crosstab matrix for the top level report will automatically be linked to the layer that you have added.
Within the Report Viewer Applet (and the Preview window), you can directly navigate and view drill-down reports. When you open a report containing drill down you can click on any entry in a column with a drill down link. You will then be taken to the sub-level report, which will take the value for that row as the parameter.
For multi-value drill-down reports, you can select Select Multiple Drill-Down Values from the Data menu in the Preview window or from the Viewer pop-up menu. This will bring up a dialog containing all the values in the mapped column. You can then select the values that you would like and click to go to the next level.
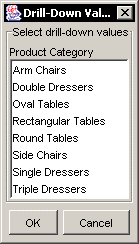
Multi-Value Drill-Down Selection Dialog
![[Note]](../../../images/note.png) | Note |
|---|---|
The templates for the sub-level reports are saved in the DrillDown directory. If you are viewing the reports on another machine, Report Viewer will look for the templates in that directory so they will have to be moved as well. |
Drill-down reports can be exported to any format, however only the DHTML and PDF formats can retain the drill-down functionality (multi-value drill-down reports only support DHTML). Any other format will only export the top-level report. The DHTML and PDF exports work in conjunction with the drill-down report servlet, which is in the DrillDownLinkGenerator directory of the installation. Before exporting the report, you will need to compile the servlet code and deploy the class file within your application server/servlet runner. When you export to DHTML/PDF from the Designer, a dialog will open, prompting you to specify the location of the drill-down servlet.
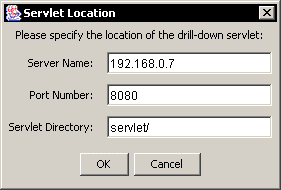
Drill-Down Servlet Dialog
The first option prompts you for the name of the server. You can either enter a machine name (i.e. machine.domain.com) or the IP address of your application server/servlet runner. The second option prompts you to specify the port number that your application server/servlet runner is using. The third option prompts you to specify the servlet directory of your application server/servlet runner. When you export this information is used to generate links for the drill-down columns.
For multi-value drill-down reports the DHTML export generates with a form at the top that allows users to select values to drill into. You will need to specify the same servlet information when exporting a multi-value drill-down report; however, instead of using the drill-down report servlet, it uses the parameter report servlet, which is under the ParamReportGenerator directory of the installation. This servlet will need to be compiled and deployed within the application server/servlet runner for these reports to work correctly.
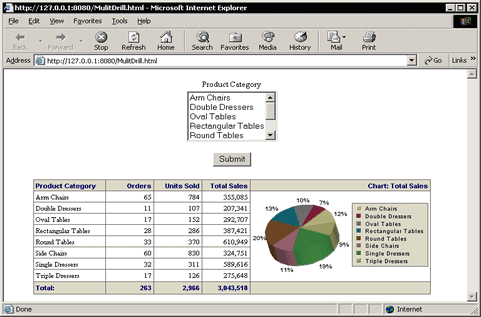
Multi-Value Drill-Down in DHTML
For more information about running drill-down reports, please see Section 2.3.5.1.1 - Sub-Reports, Charts, and Drill-Down Reports.
When you create a sub-level query with multiple parameters, you have the option of leaving some of these parameters unmapped, so that they can be prompted after clicking a drill-down link. To use this feature when selecting mapping for parameters, select none for the parameters you wish to remain unmapped. The sub-level report also contains a Data menu option Preview Parameter Prompt which determines if the parameter prompt will be displayed when you drill-down from the root level. If this level has never been previewed before this is turned off and it will use the default parameters. Otherwise, it will save the last used parameter values for future use.
Each sub-level drill-down report requires at least one mapped parameter. Thus, in order to create a report with unmapped parameters, the sub-level query must have at least two parameters. For example:
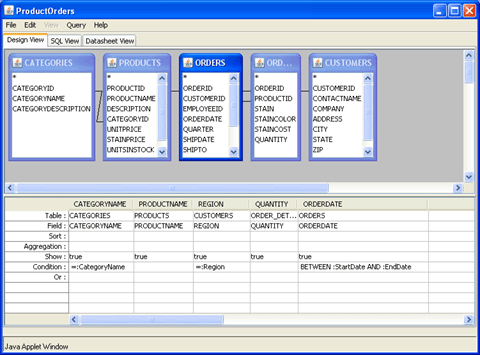
Drill-Down Level Query
Map at least one parameter to a database column and select none for the other(s)
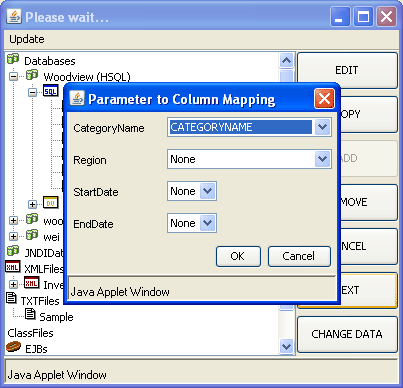
Creating Unmapped Parameters
The remainder of the creation of the drill-down report is like any other.
When you preview the report, the root report will be displayed as normal (with a parameter prompt if the root report contains parameters).
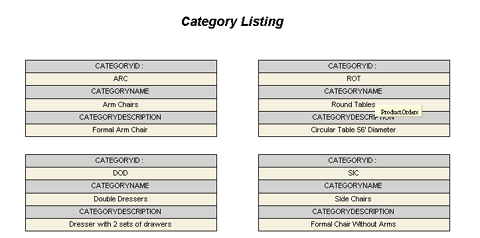
If you click on a link and the Preview Parameter Prompt menu option for the drill-down report is checked, you will see the following prompt. Notice that the CategoryName parameter is not shown:
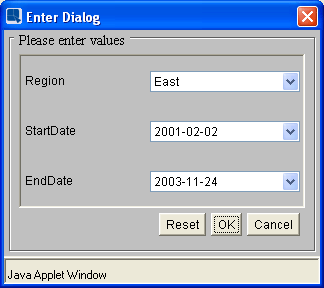
Parameter Prompt for Unmapped Drill-down
The resultant report would look like this:
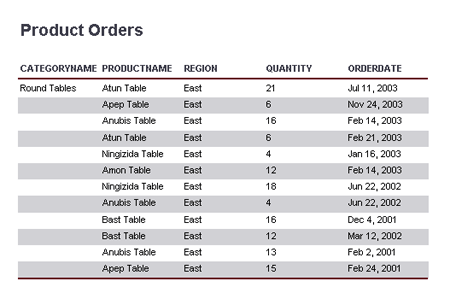
From the exported file, the default values will be used but can be changed from the filter options.