EspressReport provides an easy-to-use application programming interface (API) that enables users to create and customize reports within their own applications (and applets), on eithert the server side or the client side. It is written in 100% Pure Java, and thus can be run on any platform with little or no changes. Any and every part of the report is customizable using the API. You can use as little as a single line of code to generate a report.
The main class, QbReport, extends java.awt.Component. Associated with this component is a set of auxiliary classes consisted of 5 packages: quadbase.reportdesigner.ReportAPI, quadbase.reportdesigner.ReportElements, quadbase.reportdesigner.ReportViewer, (and its swing counterpart quadbase.reportdesigner.ReportViewer.swing), quadbase.reportdesigner.lang and quadbase.reportdesigner.util. The remainder of this document explains the constituents of the API and their usage. Please note that the complete API documentation is located at help/apidocs/index.html.
To use the API, add ReportAPIWithChart.jar and qblicense.jar (located in the EspressReport/lib directory) to your CLASSPATH. Please note that if you are using a SOAP data source or using XML (to read or write data), you will also need to add axercesImpl.jar and xml-apis.jar (also located in the same directory) in that order to the CLASSPATH. If you are exporting the charts or images to the PNG format, you will also need to include ExportLib.jar in your CLASSPATH. To export the report to an Excel file (i.e. a .xls file), you must include poi.jar in your CLASSPATH. If you want to use parameterized database queries as your data sources, add jsqlparser.jar to your CLASSPATH. If you want to export to the MS Excel 2007 format (OOXML - extension .xlsx), you must also include these files in your CLASSPATH: poi-ooxml-schemas.jar, poi-ooxml.jar, geronimo-stax-api.jar, xmlbeans.jar, dom4j.jar. If your application is on a Windows or Solaris machine, you will have to add the following environment variable (depending on the platform):
For Windows) set PATH=%PATH%;<path to EspressReport root directory>\lib
For Solaris) export LD_LIBRARY_PATH=$LD_LIBRARY_PATH:<path to EspressReport root directory>/lib
Please note that third-party jar files may also be required, depending on what your application does. For example, if you make a JDBC connection to a database, you will need to include the JDBC jar files in the CLASSPATH as well.
EspressReport provides API through which reports can be generated programmatically from scratch. However, this generally involves a significant amount of code. We recommend using Report Designer and creating a Report File (.RPT file) first, which can function as a template. This template can then be passed in the QbReport constructor and the template's look and feel can be applied to the newly created report object. Thus, at the time of the report generation, a major portion of the look and feel will have been set. You can also open a Report File (either a .RPT or a .PAK file) using the API. Using either approach, you can then write code to modify, add, or remove the properties. This approach will save you coding time and will also improve performance.
You have the option of connecting to EspressManager or not when using EspressReport Report API. While a connection is required when using Report Designer, you do not need to connect to EspressManager when running any application that utilizes EspressReport Report API. We generally recommend that you do not connect to EspressManager and thereby avoid another layer in your architecture. For more details, please refer to the next section.
All examples and code given in the manual follow the above two recommendations: a template based approach and no connection to EspressManager. Unless otherwise noted, all code examples will use a template (templates can be downloaded from corresponding chapters) and will not connect to EspressManager.
Also note that if you have applets that use EspressReport Report API, the browser must have at least a 1.5 JVM plugin.
Before we go into the details of how to create and use reports, let's explore the options of using EspressManager in an application. EspressReport is generally used in conjunction with EspressManager. The report component connects to EspressManager in order to read and write files to access databases and perform data pre-processing required for certain advanced features (such as aggregation). However, the report component can also be used in a stand-alone mode, in which it performs file I/O and database access directly, without the use of EspressManager.
For instance, the applet or application may be running on machine Client and may require data from a database on machine DbMachine. However, machine DbMachine may be behind a firewall or a direct connection may not be allowed to machine DbMachine from machine Client due to security restrictions. EspressManager can be run on machine Server and the applet/application can connect to EspressManager on machine Server. JDBC/ODBC can then be used to connect to machine DbMachine from machine Server and get the data. The data is then delivered to machine Client and the report generated. This is useful when you want to keep the data secure and non-accessible from your client machines and make all connections come through a server machine (a machine running EspressManager). You can also utilize this option to keep a log of all the clients accessing the data through EspressReport (you can have a log file created when starting EspressManager. The log file is called espressmanager.log ). Note that this functionality comes at a cost. You will face a slight performance overhead because your code is connecting to the data through EspressManager (i.e., another layer has been added).
By default, a report component requires the presence of EspressManager. To change the mode, use the QbReport class static method at the beginning of your applet/application (before any QbReport objects are created):
static public void setEspressManagerUsed(boolean b)
Both applications and applets can be run with or without accessing EspressManager. Communication is done using http protocol. The location of the server is determined by an IP address and port number passed in the API code. The instructions on how to connect to the EspressManager are as follows:
EspressManager is primarily run as an application. If you wish to use ReportAPI to connect to EspressManager running as an application, you can use API methods to specify the IP address/machine name where EspressManager is located and the port number that EspressManager is listening on.
You use the following two API methods to set the connection information:
static void setServerAddress(java.lang.String address);
static void setServerPortNumber(int port);
For example, the following lines of code:
QbReport.setServerAddress("someMachine");
QbReport.setServerPortNumber(somePortNumber);
will connect to EspressManager running on someMachine and listening on somePortNumber.
Please note that if EspressManager connection information is not specified, the code will attempt to connect to EspressManager on the local machine and listening to the default port number (22071).
Please note that these methods exist in QbReport, QbChart, QbReportDesigner and QbScheduler classes.
EspressManager can also be run as a servlet. If you wish to use Report API to connect to EspressManager running as a servlet, you will have to use the following methods:
public static void useServlet(boolean b);
public static void setServletRunner(String comm_URL);
public static void setServletContext(String context);
For example, the following lines of code:
QbReport.useServlet(true);
QbReport.setServletRunner("http://someMachine:somePortNumber");
QbReport.setServletContext("EspressReport/servlet");
will connect to EspressManager running at http://someMachine:somePortNumber/EspressReport/servlet.
Please note that these methods exist in QbReport, QbChart, QbReportDesigner and QbScheduler classes.
The following section details how to utilize the API. Again, the API examples and code is designed using the above recommendation (template based and no EspressManager).
Unless otherwise noted, all examples use the Woodview HSQL database, which is located in the <ERInstall>/help/examples/DataSources/database directory. In order to run the examples, you will need to add database HSQL JDBC driver (hsqldb.jar) to your classpath. The driver is located in the <ERInstall>/lib directory.
Also, all the API examples will show the core code in the manual.To compile the examples, make sure the CLASSPATH includes ReportAPIWithChart.jar and qblicense.jar).
For more information on the API methods, please refer the API documentation.
Reports can be saved to a file using the RPT format (a proprietary format) or XML format. A RPT/XML file stores all report information except actual data (although an option exists to save the entire data within a RPT file). This format can be used to reconstruct a report object. The data is automatically reloaded from the original data source each time the RPT/XML file is opened.
It is important to note that the RPT/XML file, by default, does NOT contain the data. It contains the specified data source along with the report template information (i.e., the look and feel of the report). Therfore, the data for the report is obtained by querying the data source when loading a RPT/XML file. This format can be obtained by using Report Designer or the export method provided in the QbReport class. You can also choose to include the complete data in the RPT file (along with the data source information).
The following example, which can run as an applet or application, reads a RPT file and reconstructs a report:
Component doOpeningTemplate(Object parent) {

	// Do not use EspressManager
	QbReport.setEspressManagerUsed(false);

	// Open the template
	QbReport report = new QbReport(parent, // container
			"OpeningTemplate.rpt"); // template

	// Show report in Viewer
	return (new Viewer().getComponent(report));
}The constructor in this example is:
public QbReport(Object parent, String file);where parent is the container and file is a RPT/XML file name.
![[Note]](../../../images/note.png) | Note |
|---|---|
File names may be specified either as URL strings or using relative/absolute paths. |
Path names are interpreted as being relative to the current directory of EspressManager or to the current application if EspressManager is not used.
A report template may contain charts, sub-reports and/or drill-down reports. These ancillary templates are saved separately from the main report template. Chart templates are saved in the chart directory, sub-report templates in the SubReport directory, and drill-down templates in the DrillDown directory. A relative URL (relative to the EspressReport installation directory) and the template name is then specified and put in the main report template.
The following example, which can run as an applet or application, reads a RPT file and sets the Chart Path:
Component doSetChartPath(Object parent)  {

	// Do not use EspressManager
	QbReport.setEspressManagerUsed(false);

	// Open the template
	QbReport report = new QbReport (parent,					// container
									"setChartPath.rpt");	// template

	// Set Chart Path
	report.setChartPath(".");

	// Show report in Viewer
	return (new Viewer().getComponent(report));
}The above code sets the location of the chart template file, thus avoiding the need to have a Chart subdirectory under the working directory of your class file.
The following methods work similarly:
QbReport.setDrillDownPath(String directory);
QbReport.setSubReportPath(String directory);
QbReport.setImagePath(String directory);
You can also pack your report in PAK format and deploy it as a PAK file. This alternative simplifies the deployment procedures by including all the chart, sub-report, drill-down, and image files that are associated with your main report into one .pak file. Your code can uses the .pak file name (instead of the .rpt/.xml) and creates the report. With the .pak file approach, you do not need to specify the directories where the chart, sub-report, and/or drill-down templates are located.
By default, report templates are always saved with two rows of backup data. This is to ensure that any template can be used to create the QbReport object, even if the data source is not present. When you create a QbReport object based on an existing template, it looks for the data source specified in the template. If the data source is not found, the backup data is used. However, you can force the API to use the backup data instead of searching for the data source using the following constructor:
public QbReport(Object parent, String file, boolean isEnterpriseServer,
                boolean optimizeMemory, boolean multiPageExp,
                boolean useBackupData);
To force the API to use the backup data, only the last argument in the above constructor has to be set to true. The values of the other boolean arguments do not matter.
Reports can also contain parameters to either limit the data in some form or to provide additional information. Typically, query (or IN) parameters are used by the data source to limit the data while parameterized formula are used to include more data within the report.
Query parameters can be both single-value and multi-value parameter types while formula parameters are single-value only.
When a parameterized template is opened using following constructor:
QbReport(Object parent, String templateName);
a dialog box appears, asking for the value(s) of the parameter(s). This dialog box is the same as the one that appears in Designer when the report is previewed.
A parameterized report can also be opened without the dialog box prompting for any value(s). This can be done by passing in two object arrays, one for the query parameters and another for the formula parameters. Each element in the array represents the value for that particular parameter.
The order of the array must match the order in which the parameters were created in Designer. For correct results, the data type of the value must also match the data type of the parameter.
Query parameters can also be multi-value parameter types. For multi-value parameters, a vector is passed to the object array. The vector contains all the values for the multi-value parameter.
The following example, which can run as an applet or application, passes in the parameter values when opening a template:
Component doObjectArray(Object parent) {

	// Do not use ERES Server
	QbReport.setEspressManagerUsed(false);

	// Object array for Query Parameters
	Vector vec = new Vector();
	vec.add("CA");
	vec.add("NY");

	GregorianCalendar beginDate = new GregorianCalendar(2001, 0, 4);
	GregorianCalendar endDate = new GregorianCalendar(2003, 1, 12);

	long beginLong = beginDate.getTimeInMillis();
	long endLong = endDate.getTimeInMillis();

	Date beginDateTime = new Date(beginLong);
	Date endDateTime = new Date(endLong);

	Object queryParams[] = new Object[3];
	queryParams[0] = vec;
	queryParams[1] = beginDateTime;
	queryParams[2] = endDateTime;

	// Object array for Formula Parameter
	Object formulaParams[] = new Object[1];
	formulaParams[0] = "Sarat";

	// Open the template
	QbReport report = new QbReport(parent, // container
			"ObjectArray.rpt", // template
			queryParams, // Query Parameters
			formulaParams); // Formula Parameters

	// Show report in Viewer
	return (new Viewer().getComponent(report));
}In addition to the above, you can also pass in the parameters using the getAllParameters method. The getAllParameters method returns a list of all parameters in the report (this includes any parameters from the sub-report that are not shared). Each parameter is obtained and the value is then set.
The following example, which can be run as an applet or application, take the same report as above and passes in the parameters using the getAllParameters method:
Component doGetAllParameters(Object parent) {

	// Do not use EspressManager
	QbReport.setEspressManagerUsed(false);

	// Object array for Query Parameters
	Vector vec = new Vector();
	vec.addElement("CA");
	vec.addElement("NY");

	GregorianCalendar beginDate = new GregorianCalendar(2001, 0, 4);
	GregorianCalendar endDate = new GregorianCalendar(2003, 1, 12);

	long beginLong = beginDate.getTimeInMillis();
	long endLong = endDate.getTimeInMillis();

	Date beginDateTime = new Date(beginLong);
	Date endDateTime = new Date(endLong);

	Object queryParams[] = new Object[3];
	queryParams[0] = vec;
	queryParams[1] = beginDateTime;
	queryParams[2] = endDateTime;

	// Object array for Formula Parameter
	Object formulaParams[] = new Object[1];
	formulaParams[0] = "Sarat";

	// Open the template with backup data
	QbReport report = new QbReport(parent, // container
			"ObjectArray.rpt", // template
			false, false, false, true);

	// Pass in parameters using getAllParameters
	report.getAllParameters().get(0).setValues((Vector) queryParams[0]);
	report.getAllParameters().get(1).setValue(queryParams[1]);
	report.getAllParameters().get(2).setValue(queryParams[2]);
	report.getAllParameters().get(3).setValue(formulaParams[0]);

	try {
		// Get the data for the report
		report.refreshWithOriginalData();
	} catch (Exception ex)
	{
		ex.printStackTrace();
	}

	// Show report in Viewer
	return (new Viewer().getComponent(report));
}The parameter prompt dialogs in Report Designer, Page Viewer, and Menu Page will display the parameters in ordered sequence. Use the overloaded method with the parameter value set to true to get a list of ordered parameters.
report.getAllParameters(boolean ordered)The results of this method will maintain two qualities. First, formula parameters will always be return first. Second, cascading parameter ordering will be maintained. For more information regarding cascading parameters, please see Section 1.3.2.2.2.3 - Cascading Parameters.
Information on the report can be changed by passing in a Security parameter when creating the report. The security levels are created in Designer and the appropriate security level is passed by using the API.
The following example, which can be run as an applet or application, opens a secure report that shows sales information for every region except West:
Component doSecurity(Object parent) {

	// Do not use EspressManager
	QbReport.setEspressManagerUsed(false);

	// Open the template
	QbReport report = new QbReport(parent, // container
			"Security.rpt"); // template

	try {
		// Set Security Level
		report.setSecurityLevel("NoWest");
	} catch (Exception ex)
	{
		ex.printStackTrace();
	}

	// Show report in Viewer
	return (new Viewer().getComponent(report));
}You can also pass in the security level using a Properties object. This is especially useful when query/formula parameters are secure.
The following example, which can be run as an applet or application, opens a secure report that shows sales information for every region except West:
Component doSecurityProperties(Object parent) {

	// Do not use EspressManager
	QbReport.setEspressManagerUsed(false);

	// Set up Properties
	Properties props = new Properties();
	props.put("security level", "NoWest");

	// Open the template
	QbReport report = new QbReport(parent, // container
			"Security.rpt", // template
			props); // properties

	// Show report in Viewer
	return (new Viewer().getComponent(report));
}When a QbReport object is created from scratch (see Appendix 2.C - Creating the Report), the report is created using default attributes. However, you can use a report template (either .rpt or .xml) to specify user defined attributes during report construction. Almost all the attributes (except for data source and report type) are extracted from the template and applied to the QbReport object. The template name usually appears as the last argument in the QbReport constructors.
You can also specify the template name using the applyTemplate(String fileName) method in the QbReport class.
The following example, which can be run as an applet or application, applies a template onto the QbReport object:
Component doApplyingTemplate(Object parent) {

    // Do not use EspressManager
    QbReport.setEspressManagerUsed(false);

    String templateLocation = "..";

    // Apply the template
    QbReport report = new QbReport (parent, // container
                    QbReport.SUMMARY, // report type
                    data, // data
                    columnMapping, // column mapping
                    templateLocation); // template

    // Show report in Viewer
    return (new Viewer().getComponent(report));

}Please note that the above code is not complete and is there as a guide. However, the link contains a complete application code that can be run.
You can also take the column mapping from the template and have it applied on the QbReport object being created. This is done by passing in “null” (without the double quotes) instead of a ColInfo[] object.
In addition to the column mapping, you also obtain the database connection information from the template (assuming the template uses a database as the datasource). This is done by passing in “null” (without the double quotes) for any of the DBInfo or SimpleQueryFileInfo parameters.
By default, when you apply templates, formulas in the table data section are not applied. To apply formulas and/or scripts from the template .rpt/.xml file to the QbReport object, you will need to use the following method:
QbReport.applyTemplate(String templateName, boolean applyFormula);You can create report templates in Designer and open those templates using the API. The QbReport object created uses the same data source as the template and attempts to fetch the data. However, it may be that while the template has all the look and feel needed, the data source may be an incorrect one. The following sections show how to open the template with backup data and switch the data source, without recreating the entire report.
Please note that for best results, the number of columns and the data type of each column must match between the two data sources (i.e., the one used to create the template in Designer and the new data source).
After switching the data source, the QbReport object must be forced to fetch the new data. This can be done by calling the refresh method in the QbReport class.
Switching the data source to point to a database is simple. All you would need to do is provide the database connection information as well as the query to be used and pass that to the QbReport object. You can provide the database connection information (as well as the query) in a DBInfo object (for more information on creating a DBInfo object, please refer to Appendix 2.B.1 - Data from a Database).
The following example, which can be run as an applet or application, switches the data source of the QbReport object to a database:
Component doSwitchToDatabase(Object parent) {

    // Do not use EspressManager
    QbReport.setEspressManagerUsed(false);

    // Open the template with backup data
    QbReport report = new QbReport (parent, // container
                    "SwitchToDatabase.rpt", // template
                    false, false, false, true);

    // New database connection information
    DBInfo newDatabaseInfo = new DBInfo(.....);

    try {
        // Switch data source
        report.getInputData().setDatabaseInfo(newDatabaseInfo);

        // Refresh the report
        report.refresh();

    } catch (Exception ex)
    {
        ex.printStackTrace();

    }

    // Show report in Viewer
    return (new Viewer().getComponent(report));

}Please note that the above code is not complete and is there as a guide. However, the link contains a complete application code that can be run.
The above approach changes the data source for the current report level only (it can be either the main report or the sub-report).
If your report template has any sub-reports, drill-down reports, or independent charts (i.e., charts that do not use the report data as the data source) and you wish to change the data sources for all of them, then you can use the setAllDatabaseInfo method under the IInputData interface. Please note that with this approach, a new query cannot be specified and the original query will be used. Only the database connection information will be changed.
The following example, which can be run as an applet or application, uses the setAllDatabaseInfo method to switch the data source:
Component doSwitchToDatabaseSetAll(Object parent) {

		// Do not use EspressManager
		QbReport.setEspressManagerUsed(false);

		// Open the template with backup data
		QbReport report = new QbReport(parent, // container
				"SwitchToDatabase.rpt", // template
				false, false, false, true);

		try {
			// Switch data source
			report.getInputData().setAllDatabaseInfo("jdbc:hsqldb:woodview",
					"org.hsqldb.jdbcDriver", "sa", "");

			// Refresh report
			report.refresh();
		} catch (Exception ex)
		{
			ex.printStackTrace();

		}

		// Show report in Viewer
		return (new Viewer().getComponent(report));
}Please note that the above code is not complete and is there as a guide. However, the link contains a complete application code that can be run.
Just as with a regular query, you can switch the data source to a parameterized query. With a parameterized query, the parameter(s) properties as well as the database connection information and the query, must be specified.
The following example, which can be run as an applet or application, switches the data source of the QbReport object to a parameterized query:
Component doSwitchToDatabaseParam(Object parent) {

    // Do not use EspressManager
    QbReport.setEspressManagerUsed(false);

    // Open the template with backup data
    QbReport report = new QbReport (parent, // container
                    "SwitchToDatabaseParam.rpt", // template
                    false, false, false, true);

    // New database connection and parameter information
    SimpleQueryFileInfo newDatabaseInfo = new SimpleQueryFileInfo(.....);

    try {
        // Switch data source
        report.getInputData().setDatabaseInfo(newDatabaseInfo);

        // Refresh the report
        report.refresh();

    } catch (Exception ex)
    {
        ex.printStackTrace();

    }

    // Show report in Viewer
    return (new Viewer().getComponent(report));

}Please note that the above code is not complete and is there as a guide. However, the link contains a complete application code that can be run.
Again, just like with regular queries, you can use the setAllDatabaseInfo method to switch to the new data source. In this approach, the original query and parameter information is used while the database connection information is altered. After switching the database information, the parameter value(s) must be specified before refreshing the report.
The following example, which can be run as an applet or application, uses the setAllDatabaseInfo method to switch the data source:
Component doSwitchToDatabaseParamSetAll(Object parent) {

    // Do not use EspressManager
    QbReport.setEspressManagerUsed(false);

    // Open the template with backup data
    QbReport report = new QbReport (parent, // container
                    "SwitchToDatabaseParam.rpt", // template
                    false, false, false, true);

    try {
        // Switch data source
        report.getInputData().setAllDatabaseInfo(...);

        // Pass in parameter value
        report.getAllParameters().get(0).setValue("TRD");

        // Refresh the report
        report.refresh();

    } catch (Exception ex)
    {
        ex.printStackTrace();

    }

    // Show report in Viewer
    return (new Viewer().getComponent(report));

}Please note that the above code is not complete and is there as a guide. However, the link contains a complete application code that can be run.
You can also change the data source to a JNDI data source. This is done by specifying the JNDI connection information in a DBInfo object and then passing it to the QbReport object.
The following example, which can be run as an applet or application, switches the data source of the QbReport object to a JNDI database:
Component doSwitchToDatabaseJNDI(Object parent) {

	// Do not use EspressManager
	QbReport.setEspressManagerUsed(false);

	// Data Source.  Replace comp with computer and env with environment.
	// The environment hashtable is empty for tomcat.
	// If other application server is used, need to set INITIAL_CONTEXT_FACTORY and PROVIDER_URL.
	DBInfo newDatabaseInfo = new DBInfo(
			"java:comp/env/jdbc/Woodview",
			"SELECT Categories.CategoryName, Products.ProductName, Products.UnitPrice, Products.StainPrice, Products.UnitsInStock FROM Products, Categories WHERE (Products.CategoryID = Categories.CategoryID)",
			new Hashtable());

	// Open the template with backup data
	QbReport report = new QbReport(parent, // container
			"SwitchToDatabaseJNDI.rpt", // template
			false, false, false, true);

	try {
		// Switch data source
		report.getInputData().setDatabaseInfo(newDatabaseInfo);

		// Refresh report
		report.refresh();
	} catch (Exception ex)
	{
		ex.printStackTrace();
	}

	// Show report in Viewer
	return (new Viewer().getComponent(report));
}Please note that the above code is not complete and is there as a guide. However, the link contains a complete application code that can be run. Note that for the application code to run, the Woodview database needs to be set up as a JNDI data source in the Tomcat environment and the application code changed to match the connection information.
You can switch the data source to a text file as long as the text file follows the Quadbase guidelines (for more details, please refer to Section 2.3.5.3.2 - Data from a Data File (TXT/DAT/XML)).
The following example, which can be run as an applet or application, switches the data source of the QbReport object to a text file:
Component doSwitchToDataFile(Object parent) {

	// Do not use EspressManager
	QbReport.setEspressManagerUsed(false);

	// Open the template with backup data
	QbReport report = new QbReport(parent, // container
			"SwitchToDataFile.rpt", // template
			false, false, false, true);

	try {
		// Switch data source
		report.getInputData().setDataFile("sample.dat");

		// Refresh report
		report.refresh();
	} catch (Exception ex)
	{
		ex.printStackTrace();
	}

	// Show report in Viewer
	return (new Viewer().getComponent(report));
}Please note that the above code is not complete and is there as a guide. However, the link contains a complete application code that can be run.
You can also specify whether the data is sorted (this improves performance) and/or the encoding for the text file. This can be done using the following method in IInputData:
setDataFile(String dataFile, boolean sortedData, String encoding);You can switch the data source to your custom XML data as long as there is a .dtd or .xml schema accompanying your data. The XML data information is specified (for more details, please refer to Section 2.3.5.3.3 - Data from an XML Data Source) and then passed to the QbReport object.
The following example, which can be run as an applet or application, switches the data source of the QbReport object to XML data:
Component doSwitchToXMLData(Object parent) {

    // Do not use EspressManager
    QbReport.setEspressManagerUsed(false);

    // Open the template with backup data
    QbReport report = new QbReport (parent, // container
                    "SwitchToXMLData.rpt", // template
                    false, false, false, true);

    // XML data source information

    XMLFileQueryInfo newData = new XMLFileQueryInfo(...);

    try {
        // Switch data source
        report.getInputData().setXMLFileQueryInfo(newData);

        // Refresh the report
        report.refresh();

    } catch (Exception ex)
    {
        ex.printStackTrace();

    }

    // Show report in Viewer
    return (new Viewer().getComponent(report));

}Please note that the above code is not complete and is there as a guide. However, the link contains a complete application code that can be run.
You can also specify whether the data is sorted (this improves performance) by using the following method in IInputData:
setXMLFileQueryInfo(XMLFileQueryInfo xmlInfo, boolean sortedData);In addition to the regular data sources, you can also pass in your own custom data. The custom data is passed to the QbReport object using either the IDataSource or IParameterizedDataSource interfaces. For more details, please refer to Appendix 2.B.5 - Data passed in a Custom Implementation.
The following example, which can be run as an applet or application, switches the data source to a custom implementation:
Component doSwitchToCustomData(Object parent) {

	// Do not use EspressManager
	QbReport.setEspressManagerUsed(false);

	// Open the template with backup data
	QbReport report = new QbReport(parent, // container
			"SwitchToCustomData.rpt", // template
			false, false, false, true);

	try {
		// Switch data source
		report.getInputData().setClassFile("Furniture_Report");

		// Refresh report
		report.refresh();
	} catch (Exception ex)
	{
		ex.printStackTrace();
	}

	// Show report in Viewer
	return (new Viewer().getComponent(report));
}Please note that the above code is not complete and is there as a guide. However, the link contains a complete application code that can be run.
You can also specify whether the data is sorted (this improves performance) and/or to prompt the parameter dialog by using the following method in IInputData:
setClassFile(String classname, boolean sortedData, boolean showPromptDialog);
You can have a custom implementation that requires parameter values, to be the new data source. In this scenario, the custom implementation must use the IParameterizedDataSource interface. For more details, please refer to Appendix 2.B.5 - Data passed in a Custom Implementation. After switching the data source information, the parameter value(s) must be specified before refreshing the report.
The following example, which can be run as an applet or application, switches the data source to a parameterized custom implementation:
Component doSwitchToCustomDataParam(Object parent) {

	// Do not use EspressManager
	QbReport.setEspressManagerUsed(false);

	// Open the template with backup data
	QbReport report = new QbReport(parent, // container
			"SwitchToCustomDataParam.rpt", // template
			false, false, false, true);

	try {
		// Switch data source
		report.getInputData().setClassFile("ProductParamInfo", false, false);

		report.getAllParameters().get(0).setValue(new Integer(25));

		// Refresh report
		report.refresh();
	} catch (Exception ex)
	{
		ex.printStackTrace();
	}

	// Show report in Viewer
	return (new Viewer().getComponent(report));
}Please note that the above code is not complete and is there as a guide. However, the link contains a complete application code that can be run.
You can also pass in data using arrays. The array data is usually stored in memory and passed to the QbReport object (for more details, please refer to Appendix 2.B.4 - Data passed in an Array in Memory).
The following example, which can be run as an applet or application, switches the data source to an array in memory:
Component doSwitchToArrayData(Object parent) {

    // Do not use EspressManager
    QbReport.setEspressManagerUsed(false);

    // Open the template with backup data
    QbReport report = new QbReport (parent, // container
                    "SwitchToArrayData.rpt", // template
                    false, false, false, true);

    // Create array data
    DbData newData = new DbData(...);

    try {
        // Switch data source
        report.getInputData().setData(newData);

        // Refresh the report
        report.refresh();

    } catch (Exception ex)
    {
        ex.printStackTrace();

    }

    // Show report in Viewer
    return (new Viewer().getComponent(report));

}Please note that the above code is not complete and is there as a guide. However, the link contains a complete application code that can be run.
You can also specify whether the data is sorted, which improves performance, by using the following method in IInputData:
setData(IResultSet rs, boolean sortedData);When changing the data source for a Drill-Down report, you use the setAllDatabaseInfo method in IInputData. However, if you are exporting the report and using the DrillDownReportServlet (for more details, please see Section 2.3.5.7.10.2 - DrillDownReportServlet), you need to get a handle to the session and use the method setDrillDownDatabaseInfo in QbReport so that the drill-down layers will know what the new data source is.
The following example, which can be run as an applet or application, switches the data source of a drill-down report:
public void doGet(HttpServletRequest req, HttpServletResponse res) throws ServletException,
	IOException
{
	HttpSession session = req.getSession(true);

	// Set the "content type" header of the response
	res.setContentType("text/html");

	// Get the response's OutputStream to return content to the client.
	OutputStream toClient = res.getOutputStream();

	try
	{
		// Do not use EspressManager
		QbReport.setEspressManagerUsed(false);

		// Open report with backup data (data source will be switched later)
		QbReport report = new QbReport(null, "SwitchDrillDownServlet.pak",
				false, false, false, true);

		// New database connection information
		String newDatabaseURL = "jdbc:hsqldb:woodview";
		String newDatabaseDriver = "org.hsqldb.jdbcDriver";
		String newDatabaseUID = "sa";
		String newDatabasePassword = "";

		// Switch data source
		report.getInputData().setAllDatabaseInfo(newDatabaseURL, newDatabaseDriver,
				newDatabaseUID, newDatabasePassword);

		// Put new data source information in session for DrillDownReportServlet
		report.setDrillDownDatabaseInfo(session, newDatabaseURL, newDatabaseDriver,
				newDatabaseUID, newDatabasePassword);

		report.setDynamicExport(true, "localhost", 8080);

		ByteArrayOutputStream tempStream = new ByteArrayOutputStream();

		report.refresh();

		// Export the report to DHTML
		report.export(QbReport.DHTML, tempStream);

		tempStream.writeTo(toClient);
	} catch (Exception e) {
		e.printStackTrace();
	}

	// Flush the outputStream
	toClient.flush();

	// Close the writer; the response is done.
	toClient.close();
}
Please note that the above code is not complete and is there as a guide. However, the link contains a complete application code that can be run. You would have to change the location of the template and deploy the servlet in order to run the code successfully.
You can also specify a connection object for the database by using the following method in QbReport.
setDrillDownConnection(Object session, Connection conn);
Just as the data source of a report can be changed, the column mapping can be modified using the API as well. However, this is not recommended as the report may have formulas and/or scripts that are data dependent. If the number of columns and/or the data of the columns do not match the original mapping, certain formulas and/or scripts may not work. While this section shows how to switch the mapping, it is recommended that in such a scenario a new QbReport object be created (see Appendix 2.C - Creating the Report) and a template applied on it.
The following example, which can be run as an applet or application, modifies the column mapping of the report:
Component doModifyColumnMapping(Object parent) {

    // Do not use EspressManager
    QbReport.setEspressManagerUsed(false);

    // Open the template with backup data
    QbReport report = new QbReport (parent, // container
                    "ModifyColumnMapping.rpt", // template
                    false, false, false, true);

    // Create new column mapping
    ColInfo[] newColumnMapping = new ColInfo[..];

    try {
        // Switch mapping
        report.getInputData().setMapping(newColumnMapping);

        // Refresh the report
        report.refreshWithOriginalData();

        // Reapply template
        report.applyTemplate("ModifyColumnMapping.rpt");

    } catch (Exception ex)
    {
        ex.printStackTrace();

    }

    // Show report in Viewer
    return (new Viewer().getComponent(report));

}Please note that the above code is not complete and is there as a guide. However, the link contains a complete application code that can be run.
An EspressReport report is made of different segments. Each segment can be set and modified independently from the others. Listed below are the various parts of the report :
A ReportElement object forms the core of objects in Report API. A ReportElement object provides a way to manipulate the contents as well as the look and feel of the individual elements. All the other report objects (such as ReportCell, ReportSection, ReportColumn etc.) extend the ReportElement class. Every part of the report is comprised of a ReportElement object, or an extension of it. Within each ReportElement object, properties such as font, color, data format, etc can be manipulated. You can also copy ReportElement objects or just apply the template of one ReportElement object to another. When a template is applied, the data of the object does not change. Only the look and feel of the ReportElement object is modified.
When modifying it, you do not get a handle to the ReportElement, but rather use the methods of the subclass (ReportCell, ReportSection, ReportColumn etc.)
A ReportCell object is used to insert labels, formulas, text, charts, or even images into different sections of the report (i.e., in the ReportSection(s) of the report). You can also use ReportCell objects to help with the formatting of the cells in the various parts of the report.
You can get a handle to a cell by using its numeric index (i.e., the position of the cell in the section), its ID (which is a string), or its custom ID (assuming the cell has one). You can use the following methods, in ReportSection, to get the desired cell:
getData(int i);
getData(String ID);
You can also get all the report cells, in a given section, by using the following method in ReportSection:
getData();
A report is divided into many sections. The following shows the different sections of a report:
- Page Header :-
This section serves as a header to the page. It appears at the top of everypage of the report.
- Table Header :-
This section serves as a header to the detail or data section of the report. By default it only appears once in the report.
- Group Header:-
This section appears in reports with grouped data (i.e. Master & Details report), or data with row breaks inserted (i.e. Summary Break report). It repeats at the top of each grouping within the report.
- Table Data:-
This is the main section of the report that contains most of the data. Data columns that have been selected for the report are placed in this section, and repeated for each entry in the column.
- Group Footer:-
This section appears on reports with grouped data (i.e. Master & Details report), or data with row breaks inserted (i.e. Summary Break report). It repeats at the bottom of each grouping within the report.
- Table Footer:-
This section serves as the footer to the detail or data section of the report. By default it appears only once in the report.
- Page Footer:-
This section serves as a footer to the page. It appears at the bottom of every page of the report.
- Report Footer:-
This is the last summary or footer section of the report. It only appears once at the end of the report.
You can get a handle to the Page Footer, Page Header, Report Footer, Report Header, and Report Table sections using the following methods in QbReport:
getPageFooter();
getPageHeader();
getReportFooter();
getReportHeader();
getTable();
and you can get a handle to the Group Footer, Group Header, Table Header, and Table Footer sections using the following methods in Report Table:
getRowBreakFooter(int breakLevel);
getRowBreakHeader(int breakLevel);
getFooter();
getHeader();
A ReportColumn object is an array of ReportCell objects that appears in the column selected. Using ReportColumn objects, formatting can be done through the entire column once, instead of applying the formatting one cell at a time.
You can get a handle to a ReportColumn by using the following method in ReportTable:
getColumn(int index);This is the main part of the report. This is the section that contains the data columns that have been selected for the report. This section contains the data that is used for the Group Footers and for the various summaries.
You can get a handle to the ReportTable section by using the following method in QbReport:
getTable();
ReportImage objects are used to add images to the report. The formats supported by EspressReport are GIF, JPEG, and PNG. The ReportImage object can be considered as a cell that contains a image. Care is to be taken to define the dimensions of the cell so that the image is clearly visible and is not truncated.
You can get a handle to all the ReportImage objects by using the following method in QbReport:
getReportImages();
ReportChartObjects are used to add charts of type TPL or CHT (Quadbase's proprietary formats) to the report. Adding in the ReportChartObject is different from adding in a ReportImage object. Here, the location of the TPL or template file is given. EspressReport then takes the template and creates a chart using the data from the relevant section. Thus, using the same template, you can have different charts at different points of the report, all of which share the same look and feel, even though the data might be different.
The chart template files are first created in Report Designer. Thus, the mapping of the chart is based on the mapping of the data in the report. We recommend using chart templates from the same type of report containing similar data mapping (i.e., the same kind of data and data type) as the report being generated using the API.
ReportChartObjects can also be used to add stand-alone charts (i.e., charts whose data is not from the report). Stand-alone charts are created from the API and the data source for the chart can be independent from the report.
Again, a ReportChartObject object can be considered as a cell that contains a chart. Similar care should be taken to define the dimensions of the cell so that the chart is clearly visible and not truncated.
You can get a handle to all the ReportChart objects by using the following method in QbReport:
getReportChartObjects();
ChartObjects are intermediate objects created before adding a chart, created completely through the API, to the report. The chart obtains its data from the report and the mapping for the chart is based on the columns of the report. These charts are different from stand-alone charts as the data for these charts is the report itself whereas the data for stand-alone charts can be independent from the report. Other chart properties such as dimension, chart type and mapping are also specified and the ChartObject created.
The ChartObject is then added to a ReportChartObject. This ReportChartObject is then added to the report.
For more details on how to use ChartObject, please refer to the Chapter 3 - Charting Guide.
ReportDocument is used to represent a clob (character large object) when adding a clob to the report. Depending on the length of the clob, it is either stored as a string in the ReportDocument or is stored in a file and the filename is stored in the ReportDocument.
Again, a ReportDocument object can be considered as a cell that contains a clob. Similar care should be taken to define the dimensions of the cell so that the content is clearly visible and not truncated.
We recommend that the ReportDocument object not be modified using the API and that all changes be done in the template.
ReportRTFObject is used to add content from a RTF file to the report. The file content is streamed to a ReportRTFObject and this object is later added to the report.
Again, a ReportRTFObject object can be considered as a cell that contains RTF content. Similar care should be taken to define the dimensions of the cell so that the content is clearly visible and not truncated.
We recommend that the ReportRTFObject object is not be modified by using the API and that all changes be done in the template.
SubReportObject is used to add sub-reports to the report. The sub-report content can either be from a file or created completely from the API.
Again, a SubReportObject object can be considered as a cell that contains a subreport. Similar care should be taken to define the dimensions of the cell so that the content is clearly visible and not truncated.
You can get a handle to all the SubReportObject objects by using the following method in QbReport:
getSubReports();
You can also get a handle to the subreport from the SubReportObject by using the following method in SubReportObject:
getSubReport(IReport qbReport);
The SubReport object obtained can then be casted to QbReport.
ReportGrid objects are used to draw grids within different sections of the table. The grid will encompass each row and each column (and each cell in the section, if applicable). Currently, the line styles available are dash, double, and solid line styles.
We recommend that the ReportGrid object not be modified using the API and that all changes be done in the template.
ReportLine objects are used to draw a line, or lines, in different sections of a table. Lines can be inserted in any part of a report. As with ReportGrid objects, ReportLine objects have a choice of three styles; dash, double, and solid line styles
We recommend that the ReportLine object not be modified using the API and that all changes be done in the template.
EspressReport has hundreds of properties, which provide a fine control over the various elements of a report. As a developer, you can customize the look and feel of a report dynamically at run-time. In order to facilitate ease-of-use, most properties have been categorized into groups and exposed in the form of interfaces. An application first obtains a handle to a group interface using a getXXX method and then manipulates the report's properties directly by calling methods on that interface. Most interfaces are contained in the package quadbase.reportdesigner.util.
EspressReport allows you to create new cells and position them where you want them in the report.
To add a cell to the report, you will need to create a ReportCell object (though it does not have to be a ReportCell object. It can also be a ReportImage object, a ReportChartObject, a ReportLine object or a ReportGrid object depending on the type of information you are adding). After creating and specifying the ReportCell properties, you can add it to any part of the report.
In the following example, a cell is added as the Page Footer:
ReportCell cell = new ReportCell("Inventory Report");
cell.setWidth(7);
cell.setAlign(IAlignConstants.ALIGN_RIGHT);
report.getPageFooter().addData(cell);
You can also apply another cell's look and feel onto the newly created ReportCell object by using the following method in ReportCell:
applyTemplate(ReportCell templateCell, boolean applyScript);Both images and charts can be included in practically any part of the report. Images of type GIF, JPEG, PNG, and charts of type TPL (Quadbase's proprietary format) are supported by EspressReport. Adding charts/images to a report generally allows for better presentation and imparts more information and makes the report easier to read and understand.
To add an image, you will need to define a ReportImage object. Within the ReportImage object, you will have to pass in the URL for the image, either as an http:// or a file:// URL. It is recommended that you use an http:// URL so that if the report is exported to an DHTML format because the DHTML report picks up the image consistently. You can also specify the image type, dimensions, and alignment of the ReportImage object and then add it to the location desired in the report.
In the following example, an image called logo3 of type gif is added to the Page Header:
ReportImage reportImage = new ReportImage();
try {

    reportImage.setImageType(IExportConstants.GIF);
    java.net.URL imageLocation =
            new java.net.URL ("http://someMachineName/Gifs/logo3.gif");
    reportImage.setImageURL(imageLocation);
    reportImage.setWidth(7);
    reportImage.setHeight(1);
    reportImage.setAlign(IAlignConstants.ALIGN_LEFT);

} catch (Exception ex)  {

    ex.printStackTrace();

}

report.getPageHeader().addData(reportImage);
You can also specify a relative link to be used instead of the complete URL specified in the code (or in Report Designer). This can be done by passing in the relative path in the following method in ReportImage:
public void setImagePath(String path);
For example, passing ../../logo3.gif in the above method would result in the DHTML export having a relative link in the <img src> tag rather than the absolute URL.
To add a chart, please refer to Appendix 3.C.15 - Adding a Chart to a Report.
You can also add hyperlinks to a cell or several cells in the report and have different hyperlinks for different cells. Hints to the link and targets can be set up in the cell and the link is then preserved when the report is exported. Note that links to RPT files can also be inserted in a report. However, the link to such files will not work outside of an applet environment. To view RPT files in DHTML format, we recommend you to create separate DHTML files and link to those files instead.
In the following example, a cell is created which contains a link to a page and is added to the Page Header:
ReportCell cell = new ReportCell("ABC Incorporated);
cell.setLink(new String("http://www.quadbase.com"));
cell.setHint(new String("Click here to go to Quadbase's Homepage"));
cell.setTarget(new String("ABC Home Page"));
report.getPageHeader().addData(cell);
While you can add a ReportGrid and ReportLine to a report using the API, we recommend that all grids and lines be inserted into a report using the Designer. To add grid lines to a report, you must define a ReportGrid object. Within the ReportGrid object, you can define various properties such as color, line style, thickness, width etc. before specifying a section to be encompassed by the grid.
In the following example, a blue grid line is added around the Report Table:
ReportGrid reportGrid = new ReportGrid();
reportGrid.setBorderColor(Color.blue);
reportGrid.setGridStyle(ReportGrid.DOUBLE);
reportGrid.setBorder(1);
reportGrid.setWidth(7);
report.getTable().addImage(reportGrid);
To add lines to the report, you must define a ReportLine object. Here, you can also define its various properties such as color, line style, thickness, width... etc before specifying the section it is added to.
In the following example, a line is added to the Page Header:
ReportLine reportLine = new ReportLine(false);
reportLine.setBorderColor(Color.red);
reportLine.setLineStyle(ReportLine.DOUBLE);
reportLine.setBorder(1);
reportLine.setWidth(7);
report.getPageHeader().addData(reportLine);
To add rich text fields to a report, you must define a ReportRTFObject object. Within the ReportRTFObject object, you can specify the location of the .rtf file and then specify the other properties of the cell before specifying a section to add the object to. Please note that a .rtf file must exist in order to add a ReportRTFObject to the report.
We recommend, however, that you do not include RTF content using this approach but rather add it to the template in the Designer.
In the following example, the content of the file RText1.rtf is added to the table data section:
ByteArrayOutputStream fileOne = new ByteArrayOutputStream();
FileInputStream fileIn = new FileInputStream("RText1.rtf");

int b = fileIn.read();
while (b != -1) {

    fileOne.write(b);
    b = fileIn.read();

}

ReportRTFObject rtfObjectOne = new ReportRTFObject(fileOne.toByteArray());
rtfObjectOne.setWidth(1);
rtfObjectOne.setHeight(.3);
rtfObjectOne.setResizeToFitContent(true);
rtfObjectOne.setX(report.getTable().getColumn(0).getWidth() + report.getTable().getColumn(1).getWidth() +
      report.getTable().getColumn(2).getWidth());    // Set Object at the end of table data

report.getTable().addRTFObject(rtfObjectOne);
// report is an object of type QbReport
The RTF file content can also be displayed in multiple column format. Thus, instead of the default column count of 1, you can show the content in 2 or more columns. The column count and the spacing between the columns can be set using the following methods:
ReportRTFObject.setColumnCount(int columnC);
ReportRTFObject.setColumnSpacing(double space);
For example, in the above example, if the following lines of code were added:
rtfObjectOne.setColumnCount(3);
rtfObjectOne.setColumnSpacing(.3);
before adding the ReportRTFObject to the report, the report would now show the RTF portion in a three column format with .3 inches separating two adjacent columns.
For more details on rich text field content, please refer to the Section 1.5.7.7 - Rich Text Fields.
To add in a nested section (nested sections) in a report, you must get a handle to the parent section and created a child section. Nested sections are extremely useful when using in conjunction with any cell or object that need resizing without the overlapping any objects below. Please note that nested sections inherit most of the section options from their parent sections except the page-breaking option.
In the following example, two nested sections are being created within the Table Header section and a ReportCell object (reportCell) is being added to one of the sections:
ReportSection tableHeader = report.getTable().getHeader();
tableHeader.addSection();
tableHeader.insertSection(0);
tableHeader.getSection(0).setHeight(.5);
tableHeader.getSection(1).setHeight(.5);
tableHeader.getSection(0).addData(new ReportCell("Test Cell"));
The index used for nested sections follows a vector index. Please note that a section will not appear even if the height is set, if there are no cells within the section.
Properties for any section of the report can be modified by getting the appropriate handle and calling the methods. Since all parts of the report extends ReportElement, almost all the properties (which can be applied to a single ReportElement object) are here and can be applied one at a time, onto a group, or in groups.
For instance, the code below will set the background color of the ReportCell object to red:
ReportCell cell;
cell.setBgColor(Color.red);
The code fragment below would set the background color of the first column of the report to be blue:
ReportTable table = report.getTable();
table.getColumn(0).setBgColor(Color.blue);
To set all the columns of the table to blue, you need to run through a for-loop, such as one given below:
for (int i = 0; i < table.getColumnCount() ; i++)
    table.getColumn(i).setBgColor(Color.blue);
Note that writing the following code
table.setBgColor(Color.blue);
does NOT set the columns in the table to have the color blue. It merely sets the color of the table section (i.e., the area behind the cells in the column) to be blue.
Similarly, the code below:
ReportCell cell;
cell.setFont(new Font("Arial", Font.BOLD, 14);
table.getColumn(0).setFont(new Font(table.getFont().getName(), Font.BOLD, 16));
sets the font for the cell and for the first column of the report. Note that setting the font for any part of the report other than a ReportCell or a ReportColumn object (such as a ReportTable or a ReportSection) involves setting the font for each individual cell in the section. You can create your own method, which sets the font for any section of the report. For instance, the code below:
void setFont(Font font, ReportElement elts[]) {

    if (elts == null) return;

    for (int i = 0; i < elts.length; i++) {
        elts[i].setFont(font);

}

setFont(new Font(table.getFont().getName(), Font.BOLD, 16), rowBreakHeaderZero.getData());
setFont(new Font(table.getFont().getName(), Font.BOLD, 18), tableHeader.getData());
creates your own method and uses it to set the font for the Row Break Zero Header and for the Table Header.
If you are planning to export your report in PDF format, True Type Fonts can also be mapped and used with the following method:
report.setFontMapping(String fontName, int style, String ttf);where fontName is the name of the font, style is a QbReport FONT constant, and ttf is the path and filename to the installed .ttf font. For example:
report.setFontMapping("Dialog", QbReport.BOLDITALIC, "C:/EspressReport/help/examples/fonts/bookosbi.ttf");For a more detailed description of PDF Font Mapping, please see the Section 1.7.2.1 - PDF Font Mapping.
Similarly, other properties can be set using the methods in the interfaces.
You can also change the format of any data (be it Numeric, boolean, or String) to conform to your requirements. The format can be set for individual ReportCell objects or for ReportColumn objects.
For example, the code below:
NumericFormat contentFormat = new NumericFormat();
contentFormat.decimal = 2;
contentFormat.currencySymbol = '$';

for (int i = table.getStartOfColumnBreakColumn(); i < table.getColumnCount(); i++ )
    table.getColumn(i).setDataFormat(contentFormat);
sets the format of the numeric data of the column break columns in the cross tab report. It adds a “$” symbol and sets the cells to show two decimal places.
Similarly, the properties for string or boolean data can also be modified to fit your requirements.
You can also represent the data (string and numeric) in a column as bar codes. This is helpful as most data sources do not have the capacity to store bar codes. And as such, only the information imprinted on the bar codes is saved, either as string or numeric data. This data can be added to the report as a column and then the data format modified to show bar codes. The format can be set for individual ReportCell objects or for ReportColumn objects. The bar code symbologies supported are Code 39, UPC A, EAN 13, Interleaved 2 of 5 and Codabar.
For example, the code below:
BarcodeFormat barCode = new BarcodeFormat(BarcodeFormat.UPCA);
table.getColumn(0).setDataFormat(barCode);
encodes the data in Column 0 as bar codes using the UPC A symbology.
You can modify the report to show a set of the highest values or the lowest values within the group. This is helpful when you want to show a report with the highest revenues or the lowest incidences of errors.
The number of records as well as the ordering is specified using the following method:
QbReport.createTopNReport(int colIndex, int topN, boolean ascending);
The colIndex argument refers to the column in the report, the topN argument specifies the number of records and the ascending argument specifies whether to show the highest or the lowest records.
For example, the code below:
report.createTopNReport(3, 20, true);
takes the highest 20 records within Column 3 (depending on the grouping of the report) and displays them in order.
Note that only Columnar, Summary Break, and Master & Details reports can be modified to a Top N report.
You can also develop your custom cell scripts. These scripts can be assigned to the cells or columns and can be run when certain conditions or requirements are met. These scripts can change the format of the cell(s) so that it looks different from its surrounding cells. Please note that cell scripting using the API is different from cell scripting in Report Designer.
The following example, which can be run as an application or as an applet, sets up a script that changes the font of any data that is less than 0:
public class myScript implements ICellScript  {

    // Format the cells according to the specified parameters
    public ReportCell formatCell(int rowIndex, ReportCell cell, Object originalData, IFormat dataFormat) throws Exception {
        if (originalData instanceof Double)
            if (((Double)originalData).intValue() < 0)
                cell.setFontColor(java.awt.Color.red);

        return cell;

    }

}
You can use the following method in ReportColumn to apply the script to a particular column:
setCellScript(ICellScript script);
Note that you can have different scripts on different columns although a column can have only one script.
EspressReport API has the capability to export reports in a variety of formats. These include PDF, DHTML, TXT, and CSV formats etc. In addition, any charts included in the report can be exported into JPEG, GIF, and PNG formats as well; although by default, the charts in the report are exported as JPEGs. The format for the chart can be changed, when creating the ReportChartObject object, by specifying the image type (use the method setImageType(int)).
A report may also be exported to the proprietary PAK format. An PAK file stores all information, except actual data. The PAK file can then be used to construct a report object. For an PAK file, the data is automatically loaded from the original data source at the time the report object is constructed. (Note PAK files can be directly viewed using a Report Viewer applet.)
To export the report, use the following method:
public export(int format, String filename)
In the above method, format is one of the format constants listed below and filename is the output filename (with or without an extension).
The following list shows the format constants available for exporting the report components:
- QbReport.CSV
Comma delimited text file
- QbReport.TXT
Delimited text file
- QbReport.DHTML
Dynamic Hyper Text Markup Language (DHTML)
- QbReport.HTML
Hyper Text Markup Language (HTML)
- QbReport.PDF
Portable Document Format, with password protection option (PDF)
- QbReport.RPT
Report File Format (RPT)
- QbReport.RPT_DATA
Report File Format (RPT) With Data
- QbReport.PAK
Pack Format (PAK)
- QbReport.XML_DATA_AND_FORMAT
Extensible Markup Language, Data and Report Template (XML)
- QbReport.XML_PURE_DATA
Extensible Markup Language, Data Only (XML)
- QbReport.XML_TEMPLATE
Extensible Markup Language, Report Template Only (XML)
- QbReport.EXCEL
Excel Format (XLS)
- QbReport.EXCEL_OOXML
xcel 2007 Format (XLSX)
- QbReport.RTF
Rich Text Format (RTF)
- QbReport.VIEW
View File (VIEW)
In addition, any charts included in the report can be exported to one of the following image formats (format given with its corresponding constant):
- QbReport.GIF
GIF
- QbReport.JPEG
JPEG
- QbReport.PNG
PNG
The following code, which can be run as an applet or application, shows how to construct and export a report:
Component doExportReport(Object parent) {
	QbReport.setEspressManagerUsed(false);
	ColInfo colInfo[] = new ColInfo[4];
	for (int i = 0; i < colInfo.length; i++) {
		//			Map data column to the Report column
		colInfo[i] = new ColInfo(i);
	}

	QbReport report = null;
	try {
		report = new QbReport
				(parent, // applet
						"ExportReport.rpt"); // template
			ReportChartObject chartObject = new ReportChartObject();
		String chartLocation0 = new String("ExportReport0.tpl");
		chartObject.setText(chartLocation0);
		chartObject.setWidth(7);
		chartObject.setHeight(3);
		chartObject.setImageType(QbReport.JPEG);

		report.getReportFooter().addData(chartObject);

		report.export(QbReport.DHTML, "ExportReport");

	} catch (Exception ex) {
		System.out.println("Cannot create the report");
		ex.printStackTrace();
	}

	return (new Viewer().getComponent(report));
}Please note that when you export the report to a text file, the default delimiter is a tab space. However, you can set another delimiter (available delimiters are “,”, “;” and “ ”) by using the following code:
report.setExportDelimiter(IDelimiterConstants.COMMA); // where report is an Object of type QbReport
When exporting the report to an Excel or Excel 2007 file, you can also set a method so that each numeric value only occupies one cell. This may be helpful if the end user intends to use Excel functions on the exported report. To use this feature, set the following method to true before exporting the report.
QbReport.setExcelExportFitCell(boolean b) You can also export the QbReport object to a byte array using the method
public byte[] exportReportToByteArray();
This will give the .rpt equivalent in the form of a byte array. This is useful if you need to serialize the QbReport object. Please note that you will still need to specify the directories for any sub-reports, drill-down, and/or charts (if you are not using EspressManager) when recreating the QbReport object from the byte array.
You can also export the report into several “pages”, instead of a single “page” i.e., the report can be exported to various files and then shown piecemeal. This option is only available for HTML, DHTML, and XML (Data + Format) export.
The following code is used to export the report into multiple files:
report.setExportToMultiPages(true);
When using this option, several files are generated (the number of files generated is equal to the number of pages in the report). The first file has the same name as the filename specified in the export method. The subsequent files have the corresponding page number attached at the end of the filename, with the file containing the last page having “LAST” in the filename instead of the page number. For example, if a three page report is exported to SalesSummary. The resulting files that are created are SalesSummary.html (contains the first page), SalesSummary_2.html (contains the second page), and SalesSummary_LAST.html (contains the last page).
You can also export a specific page at a time (instead of the complete report) and export the page to a specific file. This is done using the method:
export(int format, OutputStream out, int pageNumber);
For example, to export page 3 of a report into the html file ThirdPage, the following code is used:
FileOutpuStream dout3 = new FileOutputStream("ThirdPage.html");
report.export(QbReport.DHTML, dout3, 3);
dout3.close();
Note that you can pass in “-1” (without the double quotes) as the argument for the pageNumber to export the last page. You also do not need to setExportToMultiPages to true in order to export a specific page.
In certain constructors of the QbReport class, the parameters userPass, ownerPass, and permissions are available. These parameters are used to set the user password, owner password, and permissions for the user of the PDF document, respectively. All permissions will be granted to the owner of the PDF document (who uses the owner password to open the PDF document) while only the specified permissions in the permissions argument will be available to the user (who uses the user password to open the PDF document). Please refer to the EspressReport Java API Documentation for more detail about exporting to PDF with options.
The export method that sets PDF options is listed here for the reader's convenience.
public void export(int format,
                   java.io.OutputStream out,
                   int exportPage,
                   java.lang.String userPass,
                   java.lang.String ownerPass,
                   int permissions);
Additionally, you can also pass embed java scripts in the PDF export so that when the PDF content is streamed to a client browser, the java script is run. The following method allows java script to be embedded to a PDF content
public void export(int format,
                   java.io.OutputStream out, // Or java.lang.String specifying the file Name
                   java.lang.String userPass,
                   java.lang.String ownerPass,
                   int permissions,
                   java.lang.String javaScript);
For example, the following method sets the PDF to automatically print when it is viewed in a client browser.
QbReport report = new QbReport(......);
.......
.......
String javaScript = "this.print(true);\r";
report.export(QbReport.PDF, someOutputStream, null, null, QbReport.AllowAll, javaScript);
The above call would export the report as PDF content (with all permissions) to a stream (someOutputStream) passing data to a client browser. When the PDF is loaded on the client browser, the javascript is automatically run (which in this case, tells the browser to print the content).
You can specify a style sheet to be used while exporting the report to DHTML or HTML format. You can specify an internal style sheet or an external style sheet before exporting the report.
To export the report using an internal style sheet, you would use the following method in QbReport:
public void setUseStyleSheet(boolean state);
To export the report using an external style sheet, you first need to specify the style to be used for the specified ReportElement object by using the following method in ReportElement:
public void setStyleName(String newStyleName);
You then specify the name of the external style sheet file using the following method in QbReport:
public void setExternalStyleSheetName(String css);
For example, the following code:
report.getTable().getColumn(0).setStyleName("style_1"); // where report is an object of type QbReport
report.setExternalStleSheetName("http://someMachine/someDirectory/styles.css");
will set the first column of the report to use style_1 from the specified style sheet file (in this case, it is http://someMachine/someDirectory/styles.css).
You can export reports as a block of HTML code rather than a complete HTML file. This allows for custom content to be added to the generated HTML report.
The code given below:
report.setHeadTagIncluded(false); // where report is an object of type QbReport
generates the report as an DHTML table when the report is exported. This block can then be included in another page with more content than just the report.
You can also create your own links at the top of the page or remove links generated at the top of the pages for single page and multi page exports. This allows custom links to be added to both HTML and DHTML reports.
Custom links can be generated by implementing IHTMLLinksProvider. interface. For example, the code below, which can be run as an application or an applet, demonstrates creating custom links:
Component doCustomLinks(Object parent) {
	QbReport.setEspressManagerUsed(false);
	QbReport report = new QbReport(parent, "CustomLinks.rpt");
	report.setHTMLLinksProvider(this);
	QbReport.setExportToMultiPages(true);

	try
	{
		report.export(IExportConstants.DHTML, "CustomLinks.html");
	} catch (Exception ex) {
		ex.printStackTrace();
	}

	return (new Viewer().getComponent(report));

}

public HTMLBlock getLinksForDHTML(int cPage, int tPage, String prefix, boolean top)
{

	String linksText = "<CENTER><font face=\\\"verdana\\\" size=\\\"2\\\">" +

			"<a href=\\\"" + HTMLBlock.getFirstFileName(prefix) + "\\\">FIRST</a> | ";
	if (cPage <= 2) {
		linksText += "<a href=\\\"" + HTMLBlock.getFirstFileName(prefix) + "\\\">PREV</a> | "
				+ "<a href=\\\"" + HTMLBlock.getNextFileName(cPage, tPage, prefix)
				+ "\\\">NEXT</a> | " + "<a href=\\\"" + HTMLBlock.getLastFileName(prefix)
				+ "\\\">LAST</a> [" + "<a href=\\\""
				+ HTMLBlock.getCurrentFileName(cPage, tPage, prefix)
				+ "?x=x\\\" target=\\\"print\\\">Print Version</a>]" + "</font></CENTER>";
	} else {
		linksText += "<a href=\\\"" + HTMLBlock.getPreviousFileName(cPage, tPage, prefix)
				+ "\\\">PREV</a> | " + "<a href=\\\""
				+ HTMLBlock.getNextFileName(cPage, tPage, prefix) + "\\\">NEXT</a> | "
				+ "<a href=\\\"" + HTMLBlock.getLastFileName(prefix) + "\\\">LAST</a> ["
				+ "<a href=\\\"" + HTMLBlock.getCurrentFileName(cPage, tPage, prefix)
				+ "?x=x\\\" target=\\\"print\\\">Print Version</a>]" + "</font></CENTER>";
	}

	String text = "<SCRIPT>\n" + "document.write(\"" + linksText + "\");\n" + "</SCRIPT>";
	return new HTMLBlock(text, 100);

}

public HTMLBlock getLinksForHTML(int cPage, int tPage, String prefix, boolean top)
{
	return getLinksForDHTML(cPage, tPage, prefix, top);
}

public HTMLBlock getTOCLinkForDHTML(int cPage, int tPage, String body) {
	return null;
}Similarly other links can be generated and set to the report.
EspressReport allows a pixels per inch ratio to be specified while exporting HTML or DHTML content. This is especially useful when you are moving and deploying reports between platforms or when exporting reports in a system without any graphics. You can specify the ratio using the following method in QbReport:
public void setPixelPerInchForExport(int pixelPerInchRatio);
EspressReport allows charts with independent data sources to be pre-loaded before the report is exported. The pre-loading is simultaneous, so it improves export performance (especially if there are multiple charts in the report). You can specify to pre-load the charts by calling the following method before exporting the report:
public void preloadChartObjects();
Reports can be exported to .view files. These files are used by Page Viewer to show the report a few pages at a time (as opposed to loading the entire report in Report Viewer). Exporting to .view files is similiar to exporting to multiple pages in that the one export method results in multiple pages (the more the number of pages in the report, the more files that are generated). However, Page Viewer cannot be started unless the .view file is generated (the pages of the report are generated as .page files). EspressReport provides an interface, IExportThreadListener, which you can implement to perform actions when the first page is exported and when the export is completed.
Given below is an example using the IExportThreadListener:
public class ExportView extends Applet implements IExportThreadListener {
	static final long serialVersionUID = 1;

	public static void main(java.lang.String[] args) {

		try {
			ExportView report = new ExportView();
			report.exportView(null);
		} catch (Exception ex) {
			ex.printStackTrace();
		}

	}

	//	creates report and return it
	void exportView(Object parent) throws Exception {

		//		Turn off ReportServer as it is not needed.
		QbReport.setEspressManagerUsed(false);

		//		Create the colinfo array to be used in the QbReport constructor
		QbReport report = new QbReport(parent, "ExportView.rpt");

		report.setMultiPageExp(true);
		report.export(QbReport.VIEW, "ExportView", new Properties(), this);
		System.out.println("DONE!");

	}

	public void endAction() {
		System.out.println("END ACTION");
	}

	public void firstPageFinishedAction() {
		System.out.println("FIRST PAGE FINISHED ACTION");
		quadbase.reportdesigner.PageViewer.Viewer.main(new String[] { "ExportView.view" });
	}

}
In addition to memory optimized exporting, EspressReport also has a paging feature to handle large amounts of data. With paging, you specify the amount of memory and a temp directory. When the amount of memory used exceeds the number specified, the data is compacted and then stored on disk in the temp directory specified.
The feature works with or without EspressManager. However, if using the EspressManager, it is recommended to use the same option values in both the client code and the EspressManager.
To use memory paging export, the following code must be added before calling the QbReport constructor:
QbReport.setTempDirectory
          (<specify the temp directory to store data.  Default is ./temp>);
QbReport.setMaxFieldSize(int fieldSize);
QbReport.setPagingThreshold(int pagingThreshold);
QbReport.setPageBufferSize(int bufferSize);
QbReport.setTotalPageBufferSize(int totalBufferSize); - Max Field Size:
This argument specifies the expected maximum field size for large field types such as varchars. Fields that are larger than this value are not necessarily truncated. The behavior depends on the current memory usage in relation to the Total Paging Buffer Size allowed. As the amount of available memory decreases the amount of data stored for these large fields will decrease until it reaches this value. For example, a user is running a report with a field size that is larger than the specified Max Field Size value. When the server is not busy and there is ample memory available, the report will generate the full field without any truncation. However, when the server is heavily loaded and the available memory is near zero, the field in the report will be truncated to the Max Field Size. For numeric, boolean, date, time, and character data types, the data will never be truncated. For those database fields that are defined with a size limit smaller than the Max Field Size (e.g. Max Field Size = 500, but the field is defined as varchar(20)), the database limit will be used in place of the Max Field Size. This value is set in Bytes.
- Paging Threshold:
This property specifies when the paging feature will be activated. Once this threshold is reached, the server will begin paging the data to temporary files on the system. If this argument is set to -1 then data will never be paged. This value is independent of Page Buffer Size option. If this value is larger than the Page Buffer Size, the system will not begin paging until the threshold is reached. Therefore, each report or chart might use more memory than the amount specified in the Page Buffer Size. This value is set in Megabytes and the default is -1.
- Paging Buffer Size:
This argument allows you to set the amount of memory that each report or chart will use when the paging feature is invoked. The size of the buffer affects performance. The larger the buffer size, the faster the report or chart is generated, but the more memory is used. When the amount of total memory used by the paging system approaches the
Total Paging Buffer Size, the amount of memory provided to new reports will begin to diminish in order to avoid exceeding the specified total amount. This value is set in Megabytes.- Total Paging Buffer Size:
This argument allows you to set the total amount of memory used by the paging feature across all reports and charts. The memory allocated to each report will diminish as the memory usage approaches this value. This value is set in Megabytes.
In addition to exporting to local drives, reports can also be exported as a byte stream and streamed directly to a web browser. However, in order for charts, drill-downs, and parameters to function correctly, this export method requires that several support servlets be available. The three servlets that does this are RPTImageGenerator, DrillDownReportServlet, and ParamReportGeneratorServlet. They are located in the <EspressReport>/WEB-INF/classes/ directory. The three files must be copied to the servlet directory of your servlet runner. Use the following code to connect to the servlets:
report.setDynamicExport(true, "Machine Name or IP Address", Port);
report.setServletDirectory("Servlet Directory");
These methods sees to it that any call to these servlets are pointing to the correct machine and port. The servlets get called using the URL, http://<MachineName:>:<Port:>/<ServletDirectory:>/<Servlet:>. You must set dynamic export when streaming your report, but setting the servlet directory is optional. If you do not specify which servlet directory to use, it will be automatically set to servlet/.
Given below is an example that exports a report to DHTML and streams it to the browser. In order to run the example, you will need to configure and compile the source code, then deploy the class file in the servlet directory of your servlet runner. Replace the reportTemplate variable with either an absolute path or a path relative to the working directory of your application server. Remember that the working directory is usually not the same as the servlet directory. In addition, make sure to add ReportAPIWithChart.jar and qblicense.jar to the classpath of your application server. Both jar files can be found in <EspressReport>/lib/.
public class StreamingReport extends HttpServlet {
	static final long serialVersionUID = 1;

	@Override
	public void doGet(HttpServletRequest req, HttpServletResponse res) throws ServletException,
			IOException
	{
		// Do not use EspressManager
		QbReport.setEspressManagerUsed(false);

		// Location of report template
		String reportTemplate = "StreamingReport.rpt";

		// Create QbReport object
		QbReport report = new QbReport(null, reportTemplate);

		// Set up connection information for RPTImageGenerator and DrillDownReportServlet
		report.setDynamicExport(true, "localhost", 8080);
		report.setServletDirectory("servlet/");

		// Export the report to DHTML and stream the bytes
		ByteArrayOutputStream reportBytes = new ByteArrayOutputStream();

		try {
			report.export(QbReport.DHTML, reportBytes); // where report is an object of type QbReport
			//			report.export(QbReport.PDF, reportBytes); 		// where report is an object of type QbReport
		} catch (Exception ex)
		{
			ex.printStackTrace();
		}

		res.setContentType("text/html"); // where res is the HttpServletResponse
		//		res.setContentType("application/pdf"); 	// where res is the HttpServletResponse
		res.setContentLength(reportBytes.size());

		OutputStream toClient = res.getOutputStream();
		reportBytes.writeTo(toClient);
		toClient.flush();
		toClient.close();
	}
}
To run the example, make sure to copy the report templates to the location accessed by the code. If using a relative path (as shown in the example), remember that the current directory is the working directory of your application server. For example, since the working directory in Tomcat is <Tomcat>/bin, you will need to create the directory <Tomcat>/templates/ and copy the report templates there to run the code. The resulting report is shown below:
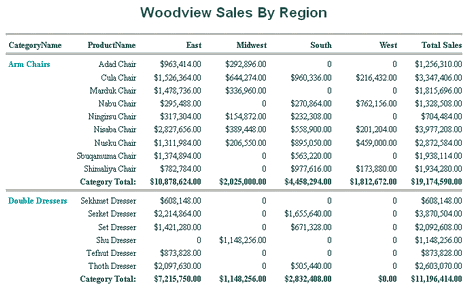
Streaming Report
The RPTImageGenerator is used when you export reports containing charts or BLOB images to either HTML or DHTML format. HTML and DHTML files are purely textual; therefore, charts and images must be stored separately. When you export a report locally, the chart is stored as an image file and the file path is appended to the IMG tag of the HTML page.
<IMG SRC="stream_0.jpg" ALIGN="CENTER" VALIGN="TOP"BORDER="0" HEIGHT="288" WIDTH="576"></IMG>
Similarly, when you stream the DHTML file, only the textual component is sent to the browser. Charts are handled in the RPTImageGenerator servlet. Instead of pointing the IMG tag to the image file, the tag is set to the RPTImageGenerator servlet and appends the ID of the chart image as a parameters.
<IMG SRC="http://localhost:8080/servlet/RPTImageGenerator?ID=1166125348416_0" ALIGN="CENTER" VALIGN="TOP"BORDER="0" HEIGHT="288" WIDTH="576"></IMG>
Reports containing images that are stored locally do not require the servlet. The IMG source will point directly to the image file. However, images retrieved from the datasource (BLOBs) are treated similar to charts and does require the aid of the RPTImageGenerator servlet.
Regardless of if you are exporting the report to a byte stream or to a file, reports with drill-downs require that the DrillDownReportServlet be accessible in order to function properly. When you export drill-down reports to either DHTML or PDF format, you must have DrillDownReportServlet in the servlet directory of your servlet runner. This servlet provides the link to the next level.
<a href="http://localhost:8080/servlet/DrillDownReportServlet? FILENAME=DrillDown%2Fstream_lvl11.rpt&FORMAT=4&PARAM0=112+Ishtar+Chair" title="tt" alt="tt">
Ishtar Chair<BR></a>
Since drill-down levels must contain a parameterized query, you need to make sure that the ParamReportGeneratorServlet is in the servlet directory as well. More information on the ParamReportGeneratorServlet are available in the next several sections.
If you export the report to HTML or DHTML, the column linked to the drill-down report will display as a hypertext link. In PDF format, the linked column will not look any different from the others; however, when you hover the mouse over that column, the cursor will change to a hand.
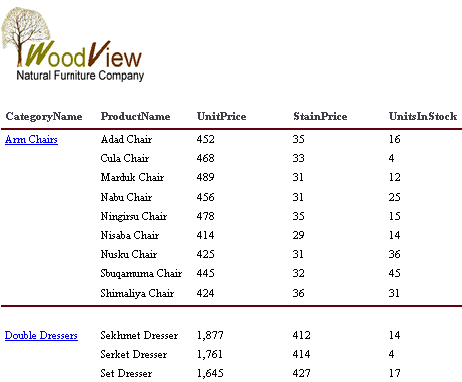
Root Level
Depending on the link clicked, the servlet delivers the appropriate next level report.
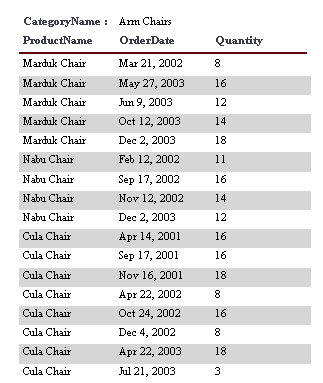
The Drill-Down Level
Note that drill-down reports exported to formats other than DHTML or PDF will only show the current level.
When streaming the report, a powerful alternative to setting parameter values using the API (discussed in Section 2.3.5.1.4 - Parameterized Reports) is to use an automatically generated HTML form that contains text or selection inputs. After the user submits the form, the parameter values are passed to the ParamReportGeneratorServlet that processes them and streams back a report initialized with these parameter values.
The main classes for this purpose are ParameterPage, ParameterPageWriter, HtmlParameterPageWriter, and CssHtmlParameterPageWriter. The typical method of generating the HTML Parameter Page involves the following code:
OutputStream out = ...; //response.getOutputStream();
ParameterPage paramPage = QbReport.getParameterPage();
Writer writer = new PrintWriter(out);
HtmlParameterPageWriter paramPageWriter = new HtmlParameterPageWriter(paramPage, writer);
paramPageWriter.writePage();
writer.flush();
writer.close();
When you use the above functionality, you must have the ParamReportGeneratorServlet in the servlet directory of your servlet runner. This servlet generates the report in the specified format using the parameters specified in the HTML page.
When you run the example, the following page is automatically generated:
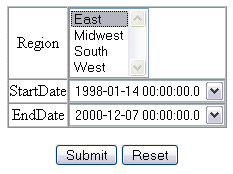
Generated Parameter Page
Depending on the values you select, clicking on the submit button may result in the following report:
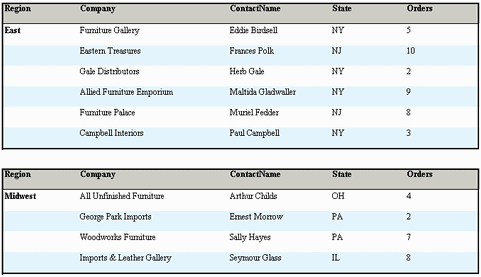
Parameterized Report
Although it is convenient to automatically generate the entire parameter page, there are times when you want more control over the appearance of the page. One way to achieve this is to only generate the main form, allowing you to design the contents around the main form to provide your own look and feel. Another way is to use CSS to set the desired format. A third way is to generate each component within the form individually giving you control over every element on the page. These various methods are discussed in greater detail in the next two sections.
Two powerful ways to alter the HTML parameter page are to add content around the form and to utilize cascading style sheets. These methods allow you to maintain a consistent look and feel to your web application, without the necessity to write an excessive amount of code.
The example below shows how these methods can be used to present the parameter page using your predefined colors, fonts, style, and format. In order to run this example, you need to modify the template path. Keep in mind that if you use a relative path, it will be relative to the working directory of your application server. You will also be required to copy the CSS file to the root directory of your web application so that it can be accessible by the CSS link in the code (alternatively, you can position the CSS file elsewhere and modify the link). The examples require that both ParamReportGeneratorServlet and DrillDownReportServlet be available in the servlet directory since the example includes a Drill Down report.
CssHtmlParameterPageWriter cssParamPageWriter =
new CssHtmlParameterPageWriter(paramPage, tempStringWriter);
// Specify the css file to be used
cssParamPageWriter.setCssFile("http://localhost:8080/CssExample.css");
// Create head of html page, adding title and css specification
cssParamPageWriter.write("<HEAD>\n" +
"<link REL=\"stylesheet\" TYPE=\"text/css\" " +
"href=\"" + cssParamPageWriter.getCssFile() + "\">" +
"\n<TITLE>Welcome to Woodview</TITLE>\n" +
"</HEAD>");
// Body section - Most of the formatting is done in the css file,
// very little is needed here
cssParamPageWriter.write("\n<body><p>
");
// Add title and fieldset
cssParamPageWriter.write("<TABLE class=\"outer\"><TR><TD>" +
"<p class=\"heading2\">Welcome to the Order History Database." +
"</TD></TR><TR><TD> </TD></TR>" +
"<TR><TD><FIELDSET><LEGEND>Select</LEGEND>");
// Add the parameter forms
cssParamPageWriter.writeBodyBody();
// Finish it off
cssParamPageWriter.write("</FIELDSET></TD></TR>" +
"</TABLE></body>\n</html>");In the above segment of code, the <HEAD> is written manually so that a title can be inserted. In the body section, only the form is generated. Using this method, users can add titles, images, and other components to maintain their own look and feel. Depending on the CSS file provided, the result might look like this:
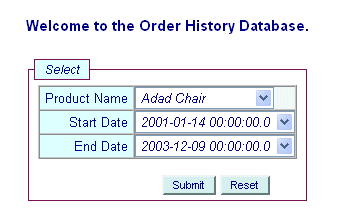
Parameter Page using CSS
Depending on the parameter options you select, the result may look like the following:
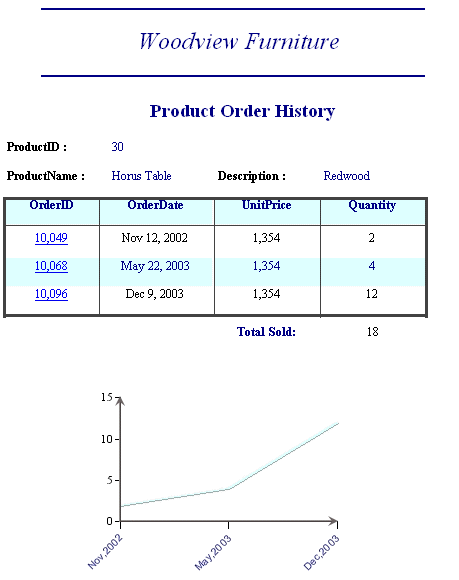
Example Results
Another way to customize the parameter page is to write a java class that extends HtmlParameterPageWriter or CssHtmlParameterPageWriter.This approach gives you access to the protected methods available in these classes. For information on the full set of methods available in these classes, please see the APIDocs
The following is an example extending the HtmlParameterPageWriter class. To run this example, you will need to copy the two html pages to the root directory of your application server. The template and java class files must be copied to the working directory and servlet directory of your application server respectively. The example also requires that ParamReportGeneratorServlet and DrillDownReportServlet be placed in the servlet directory.
private class MyHtmlParameterPageWriter extends HtmlParameterPageWriter{

    public MyHtmlParameterPageWriter(ParameterPage pp, StringWriter sw) {
        super(pp,sw); }

    public void printCustom() {
        try {
            write("<BODY bgcolor=#FDFAED>");

            write("<FORM action = \"" + servletName +"\" target=\"main\" method = GET>\n");
            write("<TABLE ALIGN=\"CENTER\"><TR><TD><IMG src=http://www.quadbase.com/FurnitureImages/Woodview.gif></TD>");
            write("<TD WIDTH=50></TD><TD>");
            writeParamTable();

            write("</TD><TD WIDTH=50></TD><TD>");
            writeSubmitButton();
            write("</TD>");
            write("</TR></TABLE>");

            writeHiddenParamValue("ReportFilePath", reportLocation);
            write("\n");

            writeHiddenParamValue("ReportExportFormat", ""+format);
            write("\n");

            writeHiddenParamValue("ServerName", servletAddress);
            write("\n");
            writeHiddenParamValue("ServletRunnerPort", ""+servletPort);

            write("\n");
            writeHiddenParamValue("ServletDirectory", servletDirectory);

            write("\n</FORM>");
            html.bodyEnd();
            html.htmlEnd(); } catch (Exception e) {
            e.printStackTrace(); } }

}
Notice that by using the protected methods, you are required to add a number of details in your code, such as FORM tags and hidden parameters. However, this also grants you the ability to add other elements such as company logos into the form section of the page and arrange the elements to your preference. This approach also allows you to eliminate certain elements from the page such as the button.
Once the files have been copied to the correct locations, you can run the example by entering the following URL in your browser: http://<IP Address/localhost>:<Port>/CustomParamPage.html. You will see a page with two frames. The top frame is the parameter page and the bottom frame initially displays a simple message. To view the report, enter the full name of a customer (e.g. Francis Polk).
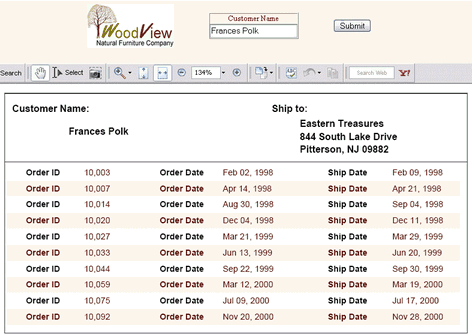
Order History Report
This example exports to PDF instead of DHTML. Although there are no links displayed in PDF format, if you hover the mouse over the Order ID column, you will see that the mouse pointer turns into a hand alerting you that you can drill-down from this column. Depending on the Order ID you selected, the follow report may be shown.
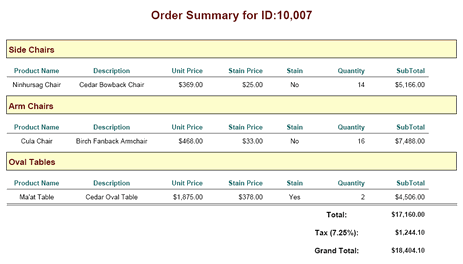
Order History Detail (Drill Down)
Report Designer can be called from Report API in either an application or an applet. Depending on the code, you can pass in parameters to open up Report Designer with a specified .rpt file or a specified data source or other parameters.
To call Report Designer from Report API, you must:
make sure that EspressManager is up and running;
add
ReportAPIWithChart.jar,EspressManager.jarandqblicense.jarto theCLASSPATH;make sure that the information to connect to EspressManager is specified using the relevant API calls (This is especially important if the EspressManager is on a different machine and/or if it started with a port number other than 22071);
copy the images, reportimages and backgroundimages directories to the working directory or use
QbReportDesigner.setUseSysResourceImages(true)in your code to use the images from the jar files;
Depending on the -RequireLogin and -QbDesignerPassword flags for EspressManager, you may need to pass in a userid and/or password to connect to EspressManager. If the -RequireLogin flag is set for EspressManager, you need to add the following line of code before calling setVisible() or any getDesigner methods:
public login(String userName, String password); // Method found in QbReportDesigner class If the -QbDesignerPassword is specified for EspressManager, you will need to add the following line of code before calling setVisible() or any getDesigner methods:
public login(String password); // Method found in QbReportDesigner class You can also specify a look and feel to Report Designer (Report Designer will use the system's look and feel by default). This is done by using the following method in QbReportDesigner:
public static void setLookAndFeel(javax.swing.LookAndFeel newLookAndFeel);
Given below are the different ways Report Designer can be called via Report API. Note that if you are running the example code as an applet, you need to change the EspressManager machine from 127.0.0.1 (or localhost) to the EspressManager machine's name or IP address.
You can open Report Designer with a specified report template file. This lets the end users create their own custom reports in Report Designer GUI and then view the finished report.
The following constructor is used:
QbReportDesigner(Object parent, String templateFileName);
Given below is an example of calling Report Designer with a specified .rpt file:
public void doReportDesignerApplet(Applet applet) throws Exception {

    // Connect to EspressManager
    QbReportDesigner.setServerAddress("127.0.0.1");
    QbReportDesigner.setServerPortNumber(22071);

    // Use images from jar file
    QbReportDesigner.setUseSysResourceImages(true);

    // Create a new QbReportDesigner instance
    designer = new QbReportDesigner(applet,
           "RDWithTemplateFile.rpt");

    // Overwrites default saveFile method
    designer.setReportIO(this);

    // Start Designer
    designer.setVisible(true);

}

// Save the file to a temp directory
public void saveFile(byte[] data, String fileLocation) {

    System.out.println("OLD LOCATION: " + fileLocation);
    String newLoc = fileLocation.replace('/', '\\');
    int idx = newLoc.lastIndexOf("\\");
    newLoc = "temp/" + newLoc.substring(idx+1);
    try {
        designer.writeFile(newLoc, data);
        System.out.println("NEW LOCATION: " + newLoc);

    } catch (Exception ex) {
        ex.printStackTrace();

    }

    designer.getDesigner().setTitle(newLoc);
    designer.getDesigner().repaint();

}
Note that the above code can be used as both an application and an applet. The above code also changes the save functionality in Report Designer so that the .rpt file is always saved in the temp directory.
When the user runs this code, the Report Designer is launched with the report template you specified.
Report Designer with Template
The user can then customize the report and save the results.
End User Customization
You can also specify the registry to use when running the above code. This is achieved by adding in the following line of code before setting the designer visible:
designer.setDataRegistry("DataRegistry/Data_Registry.xml");The above line specifies the Report Designer to use Data_Registry.xml as the Data Registry when choosing the data sources for a new report.
You can open Report Designer and have it starting with a Data Source Manager (with a specified .xml file for the Data Registry). This allows the end users to choose the data source and create their own custom reports in Report Designer GUI and then view the finished report.
The following constructor is used:
QbReportDesigner(Object parent, String nameOfXMLFile, boolean doNotStartWithOpenNewReportDialogWizard);Given below is an example of calling Report Designer with a specified .xml file:
public void doReportDesignerWithDataRegApplet(Applet applet) throws Exception {

    // Connect to EspressManager
    QbReportDesigner.setServerAddress("127.0.0.1");
    QbReportDesigner.setServerPortNumber(22071);

    // Use images from jar file
    QbReportDesigner.setUseSysResourceImages(true);

    // QbReportDesigner (component, name of XML file, boolean);
    // true = start from Data Source Manager false = start from Create a new report
    // or open existing report choice before going to Data Source Manager
    designer = new QbReportDesigner(applet, "DataRegistry/Sample.xml", true);

    designer.setVisible(true);

}
Note that the above code can be used as both an application and an applet.
You can also control what the user does at the Data Registry by enabling or disabling the options available. For example, you can remove complete or parts of data sources in the Data Registry and you can disable the options for the adding, copying, editing, and deleting of data sources. Note that the nodes are not hidden, they are removed. Therefore, when the Data Registry is opened (without any restrictions), the content of the nodes that were removed is lost. You can create a backup of the Data Registry .xml file and use the backup to enable/disable options.
Given below is an example of calling Report Designer with a specified data registry and setting it up so that only the database data sources are available and no queries or data views can be added.
public void doReportDesignerWithDataRegOptionApplet(Applet applet) throws Exception {

    // Connect to EspressManager
    QbReportDesigner.setServerAddress("127.0.0.1");
    QbReportDesigner.setServerPortNumber(22071);

    // Use images from jar file
    QbReportDesigner.setUseSysResourceImages(true);

    // QbReportDesigner (component, name of XML file, true = start from
    // Data Source Manager false = start from Create a new report or open
    // existing report choice before going to Data Source Manager
    designer = new QbReportDesigner(applet,
          "DataRegistry/Sample.xml", true);
    designer.addDataSourceManagerListener(this);
    designer.setVisible(true);

}

public JTree modifyDataSourceTree(JTree tree) {

    // The following code will remove all nodes from the tree except for
    // the database nodes.
    DefaultDataSourceNode root = (DefaultDataSourceNode)tree.getModel().getRoot();
    for (int i=root.getChildCount()-1; i>=1; i--)
    {
        // System.out.println("removing");
        root.remove(i);

    }

    // The following code will prevent the user from adding any query or dataview.
    DefaultDataSourceNode databaseHeading = (DefaultDataSourceNode)root.getChildAt(0);
    for (int i=0; i<databaseHeading.getChildCount(); i++)
    {
        ((DefaultDataSourceNode)databaseHeading.getChildAt(i)
               .getChildAt(0)).setAddEnabled(false);
        ((DefaultDataSourceNode)databaseHeading.getChildAt(i)
               .getChildAt(1)).setAddEnabled(false);

    }

    return tree;

}
Note that the above code can be used as both an application and an applet.
You can open Report Designer and have it starting at the Wizard window (with a specified DBInfo object). This allows the end users to create their own custom reports in Report Designer GUI and then view the finished report.
The following constructor is used:
QbReportDesigner(Object parent, DBInfo databaseInformation, boolean doNotStartWithOpenNewReportDialogWizard);Given below is an example of calling Report Designer with a specified DBInfo object:
public QbReportDesigner designer;
String URL = "jdbc:hsqldb:help/examples/DataSources/database/woodview";
String driver = "org.hsqldb.jdbcDriver";
String username = "sa";
String password = "";
String query = "SELECT * FROM Order_Details";

public void doReportDesignerWithDBInfoApplet(Applet applet) throws Exception {

    // Connect to EspressManager
    QbReportDesigner.setServerAddress("127.0.0.1");
    QbReportDesigner.setServerPortNumber(22071);

    // Use images from jar file
    QbReportDesigner.setUseSysResourceImages(true);

    // QbReportDesigner (component, Database Information, true = start from Data Source Manager
    // false = start from Create a new report or open existing report choice before
    // going to Data Source Manager
    DBInfo dbInfo = new DBInfo(URL, driver, username, password, query);
    designer = new QbReportDesigner(applet, dbInfo, true);

    designer.setVisible(true);

}
Note that the above code can be used as both an application and an applet.
You can open Query Builder with a specified DBInfo object. This allows the end users to create and save their own custom SQL queries in Query Builder GUI.
Given below is an example of calling Query Builder with a specified DBInfo object:
public void doQueryBuilderApplet(Applet applet, String sqlName) {

    // Connect to EspressManager
    QbReportDesigner.setServerAddress("127.0.0.1");
    QbReportDesigner.setServerPortNumber(22071);

    // Use images from jar file
    QbReportDesigner.setUseSysResourceImages(true);

    queryMain = new QbQueryBuilder(applet, this);
    if (sqlName != null) {
        // sqlName .qry file name (without extension)
        // System.out.println("OPEN QUERY - " + sqlName);
        queryMain.openQuery(sqlName, false, null, null, driver, URL, username, password);

    } else {
        // System.out.println("NEW QUERY ");
        queryMain.newQuery("Setup Query", false, null, null, driver, URL, username, password);

    }
    frame = queryMain.getBuilder();
    frame.setVisible(true);
    try { queryMain.showTablesWindow();
    } catch (Exception ex) {};

}

public void back() {};

public void cancel() {};

public void next() {

    queryMain.getBuilder().setVisible(false);
    DBInfo dbInfo = new DBInfo(URL, driver, username, password, queryMain.getSQL());
    designer = new QbReportDesigner(applet, dbInfo, queryMain.getInSet(), true);
    designer.setVisible(true);

}
Note that the above code can be used as both an application and an applet.
You can also open Query Builder by passing in the database connection (schema) as a java object, rather than as a DBInfo object. Given below is an example of calling Query Builder by passing in the schema information:
public QBWithDBInfo2() {

    // Connect to EspressManager
    QbReportDesigner.setServerAddress("127.0.0.1");
    QbReportDesigner.setServerPortNumber(22071);

    // Use images from jar file
    QbReportDesigner.setUseSysResourceImages(true);

    try {
        Class.forName(driver);
        conn = DriverManager.getConnection(URL, username, password);
        metaData = conn.getMetaData();

    } catch (Exception ex) { ex.printStackTrace(); }

    queryMain = new QbQueryBuilder(null, this);
    queryMain.newQuery("Setup Query", this);
    queryMain.setVisible(true);

    try { queryMain.showTablesWindow();
    } catch (Exception ex) {};

}

public void back() {};
public void cancel() {};

public void next() {

    // System.out.println("EXIT");

}

public String getDatabaseProductName() throws Exception {

    return metaData.getDatabaseProductName();

}

public ResultSet getTables(String catalog, String schemPattern, String tableNamePattern,
String[] types) throws Exception {

    return metaData.getTables(catalog, schemPattern, tableNamePattern, types);

}

public String getNumericFunctions() throws Exception {

    return metaData.getNumericFunctions();

}

public String getStringFunctions() throws Exception {

    return metaData.getStringFunctions();

}

public String getTimeDateFunctions() throws Exception {

    return metaData.getTimeDateFunctions();

}

public String getSystemFunctions() throws Exception {

    return metaData.getSystemFunctions();

}

public ResultSet executeQuery(String sql) throws Exception {

    Statement stmt = conn.createStatement();
    return stmt.executeQuery(sql);

}
Note that the above code can be used as both an application and an applet.
You can open Report Designer with a specified class file data source. This allows the end users to create their own custom reports in Report Designer GUI and then view the finished reports. The class file data source can be non-parameterized or parameterized.
The following constructor is used:
QbReportDesigner(Object parent, String classFile, quadbase.common.paramquery.QueryInParamSet inset, boolean newReport, int displayRow, String[] imagesPath);
Given below is an example of calling Report Designer with a specified class file data source:
public void doReportDesignerWithQueryApplet(Applet applet) {

    // Connect to EspressManager
    QbReportDesigner.setServerAddress("127.0.0.1");
    QbReportDesigner.setServerPortNumber(22071);

    // Use images from jar file
    QbReportDesigner.setUseSysResourceImages(true);

    // QbReportDesigner (component, class file location, parameter information,
    // true = start from Data Source Manager false = start from Create a new
    // report or open existing report choice before going to Data Source
    // Manager, number of rows to display (-1 means show all rows), path to
    // Report Designer images
    designer = new QbReportDesigner(applet, "ParamClassFile",
         null, true, -1, null); // Parameterized class file

    designer.setVisible(true);

    JFrame frame = designer.getDesigner();

}
For more information on creating your custom class file data source, see Appendix 2.B.5 - Data passed in a Custom Implementation.
You can also include your own functions with the Formula and Scripts dialog boxes that users can use when calling Report Designer from the API. You can in effect create functions that handle complex computations and allow any user to use that same function in Report Designer.
Given below is an example code that shows you how to customize Report Designer by assigning custom functions to the Formulas and Scripts dialog boxes. The code takes in a number and converts it to an IP address by appending the number at the end of 192.168.0.
public void doRDWithCustomFunctions(Applet applet) throws Exception {
	QbReportDesigner.setServerAddress("127.0.0.1");
	QbReportDesigner.setServerPortNumber(22071);

	QbReportDesigner.setUseSysResourceImages(true);

	designer = new QbReportDesigner(applet, "RDWithCustomFunctions.rpt");
	designer.setCustomDefinedFunctions(this);
	designer.setVisible(true);
}

public String[] getAllFunctionNames() {
	return new String[] { "inet_ntoa" };
}

public int getReturnType(String functionName) {
	if (functionName.equals("inet_ntoa")) {
		return STRING;
	}
	return -1;
}

public int[] getParamTypes(String functionName) {
	if (functionName.equals("inet_ntoa")) {
		return new int[] { NUMERIC };
	}
	return null;
}

public Object getValue(String functionName, Object[] args) throws Exception {
	if (functionName.equals("inet_ntoa")) {
		return "192.168.0." + ((Double) args[0]).intValue();
	}
	return null;
}
Note that the above code can be used as both an application and an applet.
The cell containing the function will initially display as Null since the function is not part of the core set. However, the function will compute correctly when previewing the data. The value will then be shown correctly thereafter.
You can also set the directories that reports load from and save to. This feature will restrict users from navigating to any level above the specified directory, giving you the ability to control which files the user is able to see.
Given below is an example that shows you how to customize Report Designer by specifying different directories for the load folder and the save folder:
public void doCustomizeDesignerMenuApplet(Applet applet) throws Exception {
	QbReportDesigner.setServerAddress("127.0.0.1");
	QbReportDesigner.setServerPortNumber(22071);

	QbReportDesigner.setUseSysResourceImages(true);

	designer = new QbReportDesigner(applet, "RDWithModifiedBars.rpt");

	//	Add a new menu item
	JMenuBar menuBar = designer.getReportMenuBar();
	JMenu fileMenu = menuBar.getMenu(0);
	newItem = new JMenuItem("Hello World");
	newItem.addActionListener(this);
	fileMenu.insert(newItem, 7);

	//	Remove toolbar buttons
	JToolBar designBar = designer.getDesignerToolBar();
	designBar.remove(5); // Remove Separator
	designBar.remove(4); // Remove Apply Template Button
	designer.setSaveOnExitEnabled(false); // Do not prompt to save the report if unsaved on exiting Designer

	designer.setVisible(true);

}

public void actionPerformed(ActionEvent e) {

	/*** save report **********/
	designer.save("RDWithModifiedBars_Temp.rpt");
	/**** create new testing frame *********/
	JPanel contentPane = new JPanel();
	contentPane.setLayout(new BorderLayout());
	contentPane.add(new JLabel("Hello World!"), "Center");
	JFrame frame = new JFrame();
	frame.setContentPane(contentPane);
	frame.pack();
	frame.setVisible(true);

}
Note that the above code can be used as both an application and an applet. Also, in the above example, you can choose Save As and specify a directory to save the .rpt file. However, the .rpt file will always be saved in the temp directory.
In addition to the above approach, you can also use the following method to get the default directories used by Report Designer:
public BrowseDirectories getBrowseDirectories();You can then use the methods in BrowseDirectories to get the default location of the directories for the different browse dialogs.
You can also add items to the menu and remove items from the toolbar. Given below is an example illustrating that:
public void doCustomizeDesignerMenuApplet(Applet applet) {

    // Connect to EspressManager
    QbReportDesigner.setServerAddress("127.0.0.1");
    QbReportDesigner.setServerPortNumber(22071);

    // Use images from jar file
    QbReportDesigner.setUseSysResourceImages(true);

    designer = new QbReportDesigner(applet, "help/manual/code/templates/RDWithModifiedBars.rpt");

    // Add a new menu item
    JMenuBar menuBar = designer.getReportMenuBar();
    JMenu fileMenu = menuBar.getMenu(0);
    newItem = new JMenuItem("Hello World");
    newItem.addActionListener(this);
    fileMenu.insert(newItem, 7);

    // Remove toolbar buttons
    JToolBar designBar = designer.getDesignerToolBar();
    designBar.remove(5); // Remove Separator
    designBar.remove(4); // Remove Apply Template Button
    // Do not prompt to save the report if unsaved on exiting Designer
    designer.setSaveOnExitEnabled(false);

    designer.setVisible(true);

}

public void actionPerformed(ActionEvent e) {

    /*** save report **********/
    designer.save("RDWithModifiedBars_Temp.rpt");

    /**** create new testing frame *********/
    JPanel contentPane = new JPanel();
    contentPane.setLayout(new BorderLayout());
    contentPane.add(new JLabel("Hello World!"), "Center");
    JFrame frame = new JFrame();
    frame.setContentPane(contentPane);
    frame.pack();
    frame.setVisible(true);
}
Note that the above code can be used as both an application and an applet.
You can open Report Designer with some of the Wizard steps skipped. Simply call the following functions to skip the query result, multiple data source, and pre-defined templates steps:
qbReportDesigner.setSkipQueryResultStep(true);
qbReportDesigner.setSkipMultiDataSourceStep(true);
qbReportDesigner.setSkipPredefinedTemplatesStep(true);
You can open Report Designer with customized warnings when navigating between sub-reports and drill-down report. In addition, you can also override the default Save As behavior for the Report Designer. The following example demonstrates ways to alter these various components. The example has been broken down into fragments to make it easier to read. The full source code can be found at the end of this section.
public class RDWithCustomMessage {

    public static void main(String[] args) {
        try {
            startDesigner(); } catch (Exception ex) {
            ex.printStackTrace(); } }

    static void startDesigner() {
        // Connect to EspressManager
        QbReportDesigner.setServerAddress("127.0.0.1");
        QbReportDesigner.setServerPortNumber(22071);

        // Use images from jar file
        QbReportDesigner.setUseSysResourceImages(true);

        QbReportDesigner designer = new QbReportDesigner((Frame)null);
        // modify warning message before adding drill-down layer
        designer.modifyWarningMessage(QbReportDesigner.SAVE_RPT_BEFORE_DRILLDOWN,
             "The report designer will save the current report for you, continue?");

        // modify warning message before inserting Sub-Report
        designer.modifyWarningMessage(QbReportDesigner.SAVE_RPT_BEFORE_SUBREPORT,
             "The report designer will save the current report for you, continue?");

        // by pass save as dialog when submitting save location
        designer.setReportIO(new ReportIO(designer));

        // by pass save as dialog when user try to navigate to next level
        designer.setByPassSaveAsIO(new ByPassSaveAsForReport());

        // modify chart designer from report
        designer.setChartDesignerHandle(new ChartDesignerHandle());

        // REMOVE "SAVE AS" option for Report Designer
        JMenu fileMenu = designer.getReportMenuBar().getMenu(0);
        fileMenu.remove(6);
        designer.setVisible(true); }

}
The above portion of the code modifies the warning message that is shown when adding a sub-report or a drill-down level. It also calls setReportIO , setByPassSaveAsIO, and setChartDesignerHandle to by pass the Save As dialogs (details are discussed below). The code also removes the Save As option from the menu bar in Report Designer.
public static class ReportIO implements IReportIO {

    String fileName = null;
    QbReportDesigner designer = null;

    public ReportIO(QbReportDesigner designer) { this.designer = designer; }

    public void saveFile(byte[] data, String fileName) {
        System.out.println("SAVE REPORT FILE - " + fileName);
        try {
            FileOutputStream fout = new FileOutputStream(fileName);
            fout.write(data, 0, data.length); } catch (Exception ex) {
            ex.printStackTrace(); }
        this.fileName = fileName; }

}
The above fragment implements the IReportIO interface. By setting the ReportIO in the previous code fragment, Report Designer will call the saveFile method here when the user tries to save the report. The file is passed to this method as a byte array and the filename as a string. This method creates an output stream using the filename and writes the report byte array to that stream.
public static class ByPassSaveAsForReport implements IByPassSaveAsForReport {

    public ByPassSaveAsForReport() {};

    public String getFileName(String originalFileName) {
        System.out.println("BY PASS REPORT SAVE AS OPTION...");
        if (originalFileName == null) return "TEMP_REPORT_FILE.rpt";
        else return originalFileName; }

    public Properties getSaveAsProperties(String originalFileName) {
        return new Properties(); }

}
When you by pass the Save As option, the saveFile method from the previous code fragment will obtain the filename from the getFileName method in the above class. Here, we are simplifying the process by hardcoding the name of the file. Typically, you will want to manipulate the filenames so that users do not overwrite each other's files. The getSaveAsProperties method returns a Properties instance containing any save options. Possible options include: CREATE_STL, SAVE_ALL_DATA, CREATE_HTML, USE_SWINGVIEWER, CREATE_XML, CREATE_PACK, and USE_PAGEVIEWER. Here, we choose to not use any.
public static class ChartDesignerHandle implements IChartHandle {

    public ChartDesignerHandle() {};

    public void processDesigner(QbChartDesigner designer) {
        System.out.println("PROCESS CHART....");
        // REMOVE "SAVE AS" option for Chart Designer
        JMenu fileMenu = designer.getChartMenuBar().getMenu(0);
        fileMenu.remove(6);
        designer.setChartIO(new ChartIO());
        designer.setByPassSaveAsIO(new ByPassSaveAsForChart()); }

}

public static class ChartIO implements IChartIO {

    public ChartIO() {};

    public String saveChartFile(byte[] data, String fileName) {
        System.out.println("SAVE CHART FILE - " + fileName);
        try {
            FileOutputStream fout = new FileOutputStream(fileName);
            fout.write(data, 0, data.length);
            fout.close(); } catch (Exception ex) {
            ex.printStackTrace(); }
        return fileName; }

}

public static class ByPassSaveAsForChart implements IByPassSaveAsForChart {

    public ByPassSaveAsForChart() {};

    public String getFileName(String originalFileName) {
        System.out.println("BY PASS CHART SAVE AS OPTION...");
        if (originalFileName == null) return "TEMP_CHART_FILE.cht";
        else return originalFileName; }

    public Properties getSaveAsProperties(String originalFileName) {
        return new Properties(); }

}
The above three classes makes the same changes to the Chart Designer side. The ChartDesignerHandler class removes the Save As option from the menu bar. The ChartIO class saves the file given the filename and byte array. And the ByPassSaveAsForChart class sets a fixed filename for the chart.
At times, you may want to configure what users can or cannot do when they are viewing the report using the Report Viewer or Page Viewer.
When the user is using the Viewers to view the report, right clicking on the report causes a menu to pop up. Using this menu, the user can navigate through different pages of the report, as well as perforM other tasks on the report, such as exporting it as a DHTML or PDF file. This can easily be done using the Report Viewer and Page Viewer APIs. However, these powerful features of the Report Viewer can be too complicated for the average user. Therefore, a few API methods have been introduced to control what options are available in the pop-up menu of the Report/Page Viewer.
These API calls are:
viewer.setMenuVisible(boolean b);
viewer.setPageMenuVisible(boolean b);
viewer.setPageMenuItemVisible(String[] items, boolean b);
viewer.setOutputMenuVisible(boolean b);
viewer.setOutputMenuItemVisible(String[] items, boolean b);
viewer.setRefreshMenuItemVisible(boolean b);
viewer.setGoToMenuItemVisible(boolean b);
viewer.setSortMenuVisible(boolean b);
For more detailed information on these API methods, please consult the APIDocs
Javadoc for the entire API is provided along with EspressReport. The API covers both Report and Charting API. It is located at Quadbase website.
1.1 JFC/Swing versions of Report API are also available. For more details, please refer to quadbase.reportdesigner.ReportViewer.swing
The EspressReport API provides an easy-to-use, yet powerful application programming interface for business applications. Combined with Report Designer, programming is as simple as adding one line of code to your applet. All of the attributes of a report may be set in a template file, which can be created with the Report Designer. The EspressReport API has been tested with Netscape's Communicator (4.06 and above), Microsoft's Internet Explorer (4.x and above), and Sun's Appletviewer (1.2 and above) on the Windows 95, Windows NT/2000/XP, Solaris, Linux, AIX, and HP platforms.