ERES Google Maps use two types of files: Coordinates and Map Files. Coordinates contain location of individual map points (e.g. cities, company branches). Coordinates have to be created before creating a map. One set of Coordinates can be shared by several maps, so you do not have to maintain more files. It is enough to add a map point in the Coordinates and it is added to all the maps, which are using these Coordinates. For more information about Coordinates, see Section 4.3.3 - Creating Coordinates. Map File displays map markers based on Coordinates and defines DrillDowns and Tooltips.
Before using the Google Maps in ERES, you will have to register with Google and create your own Google Maps API Key. Visit Google Maps to learn how to sign up and create your key. When registering, pass valid data, especially the domain address you will be running ERES on. The Google Maps API Key is a case sensitive sequence of characters and numerals, and will be provided to you after registration. After obtaining your own API Key, navigate to the Administration Console and fill in the Google Map Key under the Setting Info tab. For more information, please visit Section 1.4.1.2 - Setting Info.
![[Note]](../../../images/note.png) | Note |
|---|---|
ERES does not distribute the Google Maps API Key. You have to register to obtain a key. |
Launch Map Builder, select the option and click . Select data registry (Note: if you have only one data registry in Data Registry Manager, this step will be automatically skipped. For more information about managing data registries visit Section 2.4.1 - Managing Data Registries). Select the desired data source and click . A view of the data, displaying first ten records of selected data source, will appear.
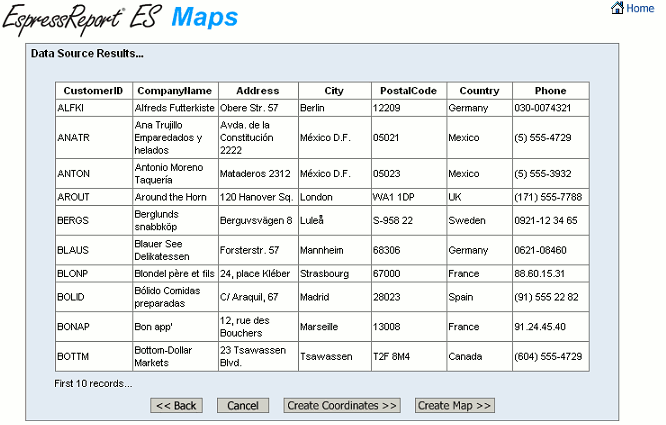
Data Source Results
The Coordinates file contains the coordinates of map points. Each Coordinates data record consists of latitude and longitude (obtained automatically or manually) and a Point ID. The Point ID is an identifier of the place (e.g. city name, branch name etc.) and it is loaded from the data source where you selected to create the Coordinates. The Point ID can consist of several Point ID fields - each data source column creates one field (except the fields, which contain longitude and latitude). So if your data source contains two columns - City and State, the Point ID will consist of two fields - City and State.
Each map point should have unique Point ID, so any map point can be distinguished from the others. The data source should be chosen wisely to fulfill this condition (each row of data should be unique, there must not be duplicates).
The Point ID is used for mapping map markers to the map data source in the Map File, so it should contain data, which occurs in the map data source and which uniquely identifies map points. For example, if you want to display cities where your company has some customers, you should use City name and State name as Point ID fields. The State name is useful in case when there are more cities with the same name in several different states. Optionally, you can add more Point ID fields for more detailed specification of city. For example if there are two cities with the same name in the same state. Then you should use some more Point ID field, which would distinguish between these two cities.
To create Coordinates, launch Map Builder and choose a data registry (For more information, please see Section 4.3.2 - Selecting Data Source). It is recommended to use a non-parameterized data source. If you use a parameterized data source, the default parameter values will always be used. There is no way to set parameter values of Coordinates data source.
After selecting data source, click on the button in the Preview Results screen. ERES Maps will prompt you to select a method for obtaining coordinates from the data source. The choices are:
This option requires two numeral data source columns containing information about the latitude and longitude of particular map point. Latitude and longitude have to be in different columns. The data type of these columns should be double and they should contain latitude and longitude in the decimal degree notation. Positive longitude means East longitude, negative means West. Positive latitude means North latitude, negative means South.
In this case map point latitudes and longitudes are read from the data source every time a map, which is using this Coordinates, is open. If the data source changes, the change is reflected in the map (e.g. if new map point is added, it will be displayed on the map). It is not necessary to edit this Coordinates anymore. It is enough to update the data source.
If Geocoding or Manual insertion of the map point coordinates is used, it is necessary to edit the Coordinates every time you want to add or modify (move) map point.
Positions will be determined automatically using point addresses. The addresses can consist of several data source columns. You can select columns, which contain Address 1, Address 2, City, Postal Code, State, Province, and Country. You do not have to fill all the fields. If you do not fill any field, you will be automatically switched to the manually option (see the next chapter). The name of the Geocoding fields are only illustrative, they do not have to be filled with exactly this information. The only rule you should keep in mind is to use the more specific information (e.g. street address) before the less specific (e.g. state). If your data source column contain more then just one field, use the first suitable field (e.g. if there is column with full address, you should use the Address 1 field and leave the rest empty). Geocoding is very adaptive, it does not require any specific format of addresses and is able to find even inaccurate or incomplete addresses.
Please note that Geocoding is not supported for all countries. To see the list of currently supported countries, visit Google Maps Coverage and select Yes in the geocoding dropdown menu.
After choosing a method of obtaining coordinates, you will get the main Coordinates Designer window, as seen in the screenshot below.

Main Coordinates Designer window
There are the following buttons on the Toolbar:
| New: Creates new Map/Coordinates |
| Open: Opens existing Map/Coordinates |
| Save: Saves current Coordinates to file and Organizer. Note that all saved files will include the userID and the timestamp in addition to the name you have provided. If an organizer item with the supplied name exists in the folder, you will be given a choice to override the existing item or create a new entry. |
The left part of the window displays the Google Map, which displays individual map points using map markers. The Google Map can be scrolled and zoomed to find specific. To learn more about using Google Maps controls visit Google Maps User Guide.
Point ID table in the right part of the window shows all the Point IDs, which were read from the data source, and longitude and latitude of map points. Each row represents one Point ID and can have one of the following background colors:
White: Location of the corresponding map point has been successfully determined. | |
| Light red: Location of the corresponding map point has not been determined yet. You have to enter it manually. |
| Dark red: Same as the light red, but marks the Point ID, which is currently under mouse cursor. If you click on the row, you will be able to insert new point corresponding to this Point ID. |
| Yellow: Highlights the row with Point ID of the map point under the mouse cursor on the map (this serves to determine what Point ID belongs to what map marker). |
| Green: Indicates that there are some Geocoding matches for the selected Point ID. |
If the coordinates were obtained from the data source (see Section 4.3.3.1 - From Data Source) all the map points are placed automatically according to the data from the data source, so all the rows are white. In this case, the Coordinates are read-only - you can only check what map marker belong to what Point ID by holding mouse over a map marker/Point ID. The associated Point ID/map marker will be highlighted with the yellow color. If you want to change position of a map point, you have to modify the data source directly (i.e. change the longitude and latitude in the appropriate data source column).
If you selected Geocoding (see Section 4.3.3.2 - Geocoding), the Geocoding process is started automatically after you enter the Coordinates Designer. It goes through all the Point IDs and try to determine position of the corresponding points from their addresses. If it finds exactly one result, the map point is inserted automatically. The new point and the corresponding Point ID will turn yellow for a moment and then the Point ID will turn white, which indicates that the position is already determined. The toolbar is disabled during Geocoding, so you have to wait until it is finished before performing other actions. You can watch the Geocoding progress on the status bar. After the Geocoding is done, you should insert the points that were not inserted automatically. These are points for which there were no Geocoding results or more than one Geocoding result. The process is the same as for the manual point inserting and it is described in the next paragraph.
The last option is inserting the map points manually (see Section 4.3.3.3 - Manually). In this case, all the Point IDs are light red at the beginning, which means that their position is not determined. To place a map point, click on a Point ID (row in the table) first. The Point ID row will turn dark red and cursor will change to crosshair. Click on the location where you want to put the map point to. A new map marker will be placed on the selected map point and the appropriate row will become white. Then you can place another map point in the same way.
If you were using Geocoding and now you are only inserting the rest of the points manually, the Point ID row may turn green instead of dark red after you click on it. This is in case, that there are more than one Geocoding result. These results are displayed on the Google map with green markers so you can select the right one by clicking on it. If the desired map point is not among the geocoding results, you can still add the map point manually on the correct place in the same way as for manual inserting (by clicking on the desired place with the crosshair cursor). If you hold mouse over a geocoding result (green map marker), the full address of this map point is displayed to help you identify the correct place.
Please note that the Geocoding is not 100% accurate, so you should check all the results that were inserted automatically.
You can move any of the already existing map points by dragging appropriate map marker with mouse or delete any map point by right clicking on the map marker.
If you want to use the Coordinates for creating maps, be sure to save it to Organizer (click the ![]() icon and select any Organizer folder in the drop-down menu).
icon and select any Organizer folder in the drop-down menu).
ERES Google Maps needs Coordinates to map the data source records to map points. When creating Google Maps, you have to map the Point ID fields from the Coordinates file to the map data source columns. According to this mapping, data source rows are associated with map points. There can be more data source rows associated with one map point but not vice versa (because Point IDs should be unique). The rows associated with a map point are used to generate Tooltips (see Section 4.3.6.1 - Google Maps Tooltips) for the appropriate map marker.
Not all the Point ID fields have to be mapped. For example, if your Point ID has three fields - City, State, and Country, you can map only Country and State. But you have to keep in mind that any map point should be uniquely determined by the mapped Point ID fields. So if there are two Point IDs in your Coordinates, which differ only in City, but have equal Country and State, you have to use the City as well to distinguish between those two map points. You will get no error message if you use wrong mapping, but the data can be displayed incorrectly.
Some map points from the Coordinates may not have any associated rows. These map points are not displayed on the map using map markers. Only the map markers, for which some data was found in the data source, are displayed. So you can have Coordinates containing all the major cities in USA, but you can display only the one you are interested in. And you can use the same Coordinates for different map, which will show different set of cities, because the data source will contain data for different cities. So you do not have to maintain too many Coordinates files if you choose suitable Point ID fields.
Example:
Your data source contains the following data and you want to display data grouped by cities on a map:
| Row # | City | State | Customer Name | Sales |
|---|---|---|---|---|
| 1 | San Francisco | CA | Company A | $152,560 |
| 2 | New York | NY | Company B | $240,468 |
| 3 | Los Angeles | CA | Company C | $335,256 |
| 4 | San Francisco | CA | Company D | $80,381 |
| 5 | Boston | MA | company E | $23,540 |
| 6 | Chicago | IL | Company F | $124,532 |
You will have to create the Coordinates first. In this case only the City name could be used as the Point ID because it is unique. But we will rather use two Point ID fields - City and State, for the case that there will occur more cities with the same name in different states in the future. So we will create data source with two columns - City and State. This data source has to contain all the listed cities (and could contain some more). We could either write a suitable query to obtain these two columns from the original data source (if using a database for the data source) or we can, for example, create a simple text file data source with these two columns.
Next, we can start Coordinates Designer and create the Coordinates. We do not know longitudes and latitudes, so we can not use coordinates from data source but we know part of an address, so we will use Geocoding. Using Geocoding, we will assign longitude and latitude to every city. So the table in the Coordinates Designer would look like this (note that there is one extra city - Orlando, which is not in the map data source):
| City | State | Longitude | Latitude |
|---|---|---|---|
| San Francisco | CA | -122.419204 | 37.775196 |
| New York | NY | -73.985506 | 40.757929 |
| Los Angeles | CA | -118.243425 | 34.052187 |
| Chicago | IL | -87.624333 | 41.879535 |
| Orlando | FL | -81.364438 | 28.553154 |
Now, you can create map from the data source using these Coordinates. You map City Point ID field to the City data source column and State Point ID field to the State data source column. The Point IDs will be paired with the data source rows - San Francisco with the first and fourth, Chicago with the sixth. Orlando does not have any matching row in the data source, so it will not be displayed at all. If you add Tooltip, the associated rows will be used to generate it. For example, the Tooltip for San Francisco will be created using data from the 1st and fourth row of the data source.
If you add a new city to the data source and you want to display it too, you have to edit the Coordinates data source first and add the city there. Next, you can open the Coordinates in the Coordinates Designer and there will be one new row in the table with this new city. This enables you to add the new map point for this city. You do not have to modify anything in your map. Therefore, if this Coordinates is shared among several maps, the map point is added automatically to all these maps.
ERES Google map is a special kind of report that allows displaying geographical data on map. It points out the reported geographical data on a map by using map markers. Markers can be used as drill-down links to parameterized reports, charts, or maps. Markers may also have tool-tips. Tooltips look like bubbles, containing a report or chart. When tool-tips are enabled, every map marker has its own tool-tip bubble, which displays data associated to this map point. Only one tool-tip bubble can be displayed at the time. A tool-tip appears when you move the mouse cursor over a map marker. It closes automatically when you open different tool-tip, or it can be closed by clicking on the sign in the upper right corner of the tool-tip bubble.
To create a Google Map, launch Map Builder and choose a data registry. Click on the button. Select Google Map and click . Select a suitable Coordinates and click . You will be prompted to select point mapping, i.e., you have to pair columns that will enable ERES Maps to assign records from maps record's data source to suitable Point ID fields from the Coordinates (e.g. if you want to show cities with your affiliates on map, your Coordinates may contain a column called City which is mapped to Affiliates_City from the map's data source). You have to map at least one column and click . Map Builder will appear. You can see the main Map Builder window in the screenshot below.
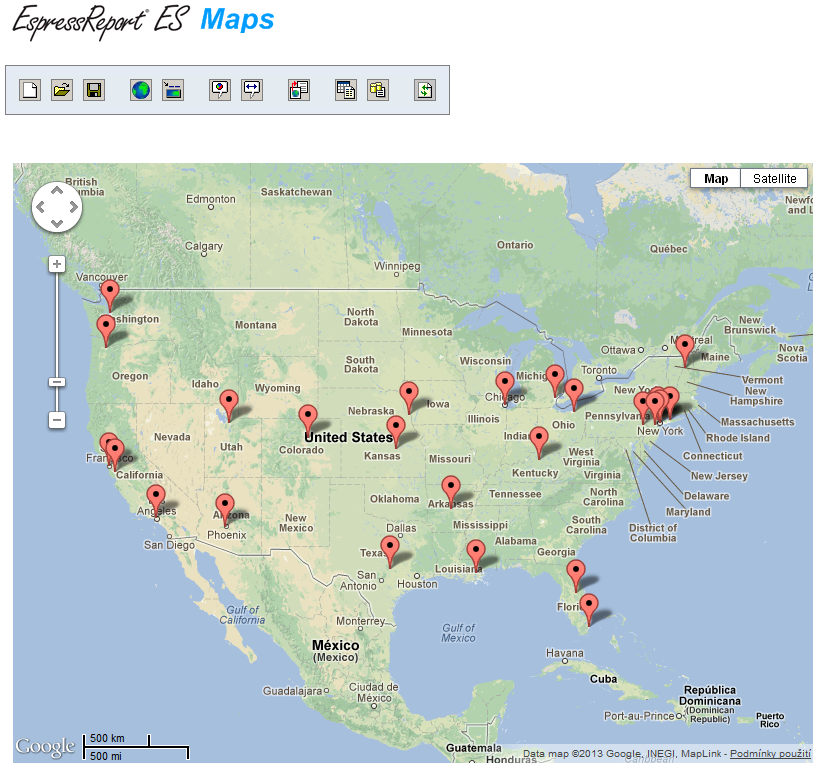
ERES Map Builder
There are the following buttons in the Map Builder toolbar:
| New: Creates new Map/Coordinates |
| Open: Opens existing Map/Coordinates |
| Save: Saves current Map to file and Organizer. Note that all saved files will include the userID and the timestamp in addition to the name you have provided. If an organizer item with the supplised name exists in the folder, you will given a choice to override the existing item or create a new entry. |
| Map Options: Allows you to change the way the Google Map is displayed |
| Map Title Options: Allows you to set map title and its options |
| Tooltip Template: Adds/Modifies report/chart templates used as tool-tips |
| Tooltip Options: Allows you to change dimensions of tool-tip bubbles |
| DrillDown Options: Configures drill-downs |
| Change column mapping: Changes the column mapping |
| Change Data Source: Changes the data source of current map. Note that changing data source will result in loosing tool-tip and drill-down settings. |
| Refresh / Set Parameters: Refreshes the map data (if the data source changed). This button also allows you to set different parameters for parameterized maps. |
Below the toolbar, there is a preview of the Google Map. To learn more about operating Google Maps controls visit Google Maps User Guide.
Tool-tips may contain a report, chart, or report with charts that show up when you move mouse cursor over any map marker on the Google Map. Tool-tips display only the data that is related to the particular map point. The report or chart file that is displayed in the tool-tip bubble is called Tooltip Template.
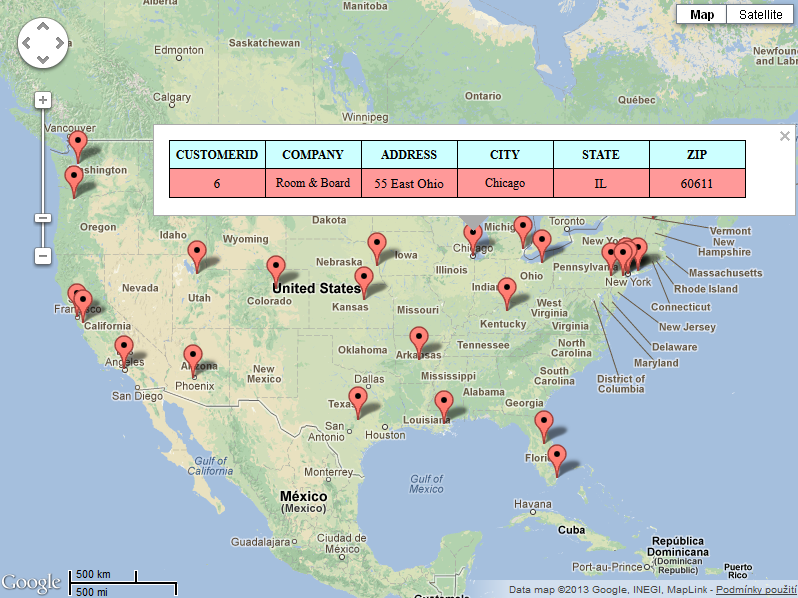
Google Map with Tooltip
To enable tool-tips for ERES Google Map, open the Map in Map Builder and click on the ![]() icon. A new web browser window will open showing four options:
icon. A new web browser window will open showing four options:
- Create new template:
Launches QuickDesigner that will allow you to create new report/chart file. Please note that you should leave the QuickDesigner using the button from the Toolbar if you want to apply changes. Closing this QuickDesigner window in any other way (for example, using the close button of the window) is considered to be cancellation of the operation, so the tool-tip is not applied.
- Select existing template:
Uses existing report/chart from Organizer as Tooltip Template. Using this option, you can also use the report/chart templates created in the Report Designer/Chart Designer, so you are not limited to use just the QuickDesigner to design Tooltip Templates. In this case, it is recommended to use exactly the same data source for creating this Tooltip Template report/chart as for the map. Otherwise, there may be problems with data mapping.
- Edit current template:
Allows you to modify the report/chart that is currently set as Tooltip Template in QuickDesigner. This option is available only when the Tooltip Template is already set and if it was created in QuickDesigner (not in the Report/Chart Designer).
- Remove current template:
Removes current Tooltip Template and disables tool-tips for current map. This option is available only when a Tooltip Template is already set. Tool-tips can be re-enabled by selecting a Tooltip Template again.
To configure dimensions of the tool-tip bubbles, go to the Map Builder and click on the ![]() icon. Changes will take effect after closing the current tool-tip bubble (if any bubble is open, otherwise the changes will take effect immediately).
icon. Changes will take effect after closing the current tool-tip bubble (if any bubble is open, otherwise the changes will take effect immediately).
To enable drill-downs in map, click on the ![]() icon. Check the Enable-Drill-Down checkbox which will show you all the parameterized reports, charts and maps saved in Organizer. Click on a suitable parameterized report, chart, or map and select parameter mapping. All drill-down parameters have to be mapped to some Point ID field from the Coordinates. Mapping in this case means that the Point ID values of the selected map point will be used as drill-down parameter values (each map marker has unique Point ID). When you click on a map marker on the map, the drill-down report/chart/map will open in a new browser window.
icon. Check the Enable-Drill-Down checkbox which will show you all the parameterized reports, charts and maps saved in Organizer. Click on a suitable parameterized report, chart, or map and select parameter mapping. All drill-down parameters have to be mapped to some Point ID field from the Coordinates. Mapping in this case means that the Point ID values of the selected map point will be used as drill-down parameter values (each map marker has unique Point ID). When you click on a map marker on the map, the drill-down report/chart/map will open in a new browser window.
If all the drill-down parameters are multi-value (see Section 2.4.3.2.2.1 - Multi-Value Parameters), you will be allowed to select multiple map markers at once. This can be done by clicking on the button (see the image below; the button is displayed only if the map contains multi-value DrillDown). Then you can select multiple map markers by dragging using bounding box.
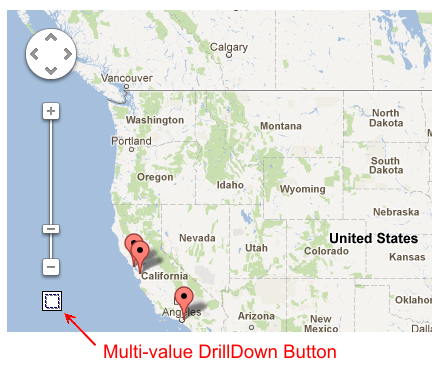
Multi-value DrillDown button
To enable map title, click on the ![]() icon. Check the Enable Map Title checkbox. Then you can insert the map title text and select various options - font, font style, font size (positive integers only), text alignment, title position, and text color. The color can either be chosen from swatches or inserted manually by entering red, green and blue components (all the values has to be integers from 0 to 255).
icon. Check the Enable Map Title checkbox. Then you can insert the map title text and select various options - font, font style, font size (positive integers only), text alignment, title position, and text color. The color can either be chosen from swatches or inserted manually by entering red, green and blue components (all the values has to be integers from 0 to 255).
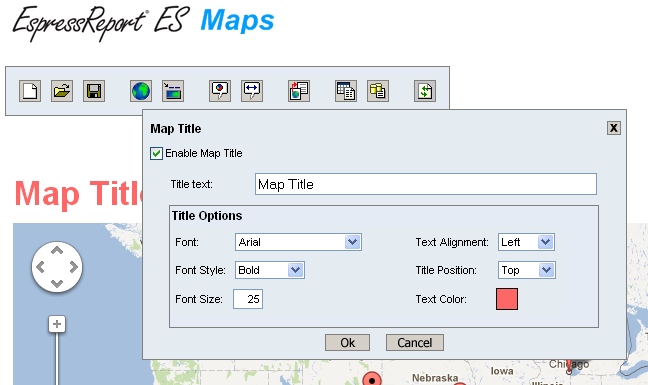
Map Title Options Dialog
Each ERES Google Map uses data from two data sources - the first is used for Coordinates and the second is for the map itself. This chapter explains where and how these data source are used.
The Coordinates data source is used when you are creating Coordinates. It is used for obtaining all the Point IDs. Rows of this data source represent Point IDs. Columns are Point ID fields. Point IDs should be unique, so there should not be duplicate rows in this data source. It is recommended not to use parameterized data source for Coordinates because there is no way to set parameter values for Coordinates. If you use a parameterized data source for Coordinates, the default parameter values are always used.
The Coordinates data source can also contain coordinates (longitudes and latitudes) of the map points. The longitudes and latitudes have to be stored in two separated columns of double data type. These columns are not used as Point ID fields. If the coordinates are read from the data source, they are fetched every time the map is generated. So if there is a change in the Coordinates data source, it will be reflected in the map immediately. If the coordinates are not read from the data source, they are stored directly in the Coordinates file. In this case, the Coordinates data source is accessed only when you are creating or editing the Coordinates in the Coordinates Editor. When you are creating or displaying a map that is using this Coordinates, the data source is not accessed at all, because all the necessary information is in the Coordinates file. So it is even not necessary for this Coordinates data source to be available when the map is created/displayed.
The map data source has two purposes. The first is that it contains data that are used for Tooltips. The second purpose is filtering. The map data source is mapped to the Coordinates as described in the Section 4.3.5 - Coordinates Mapping and only those map points from the Coordinates that have at least one associated row in the map data source are displayed. The map data source can be parameterized. In this case, whole the map is parameterized. If you create/open map that is using parameterized data source, you will get parameter prompt, which allows you to enter parameter values.