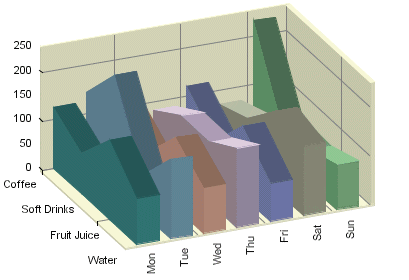
Three-Dimensional Area Chart
A three-dimensional area chart may be viewed as a derivative of a column chart. A three-dimensional area chart may be constructed from a three-dimensional column chart in the following manner. For each data series (Z-axis) value, the tops of all the columns are joined together by a thick line. The columns are then removed and the area (in the XY plane) under each line is filled with a distinct color.
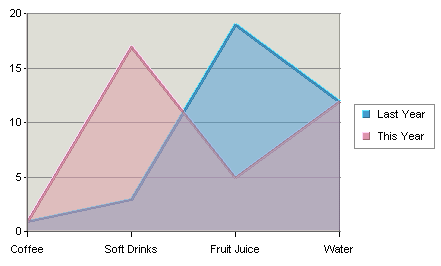
Two-Dimensional Area Chart
A two-dimensional area chart is essentially a projection of its three-dimensional counterpart viewed along the Z-axis. As a result, a two-dimensional area chart may sometimes hide a data series value altogether. Therefore, it must be used with caution. The chart above illustrates this point: in a two-dimensional display some parts of each series are concealed by a series in front. To ameliorate this problem, you can change the ordering of the data series (see Section 6.8.3 - Data Ordering) or set the area translucent (see Section 6.1.3 - Format Menu) as in the example above.
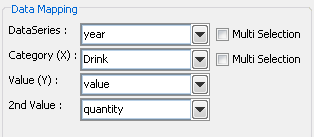
Mapping Options for Area Charts
Data mapping for area charts is almost exactly the same as for column charts (discussed in Section 5.2.1 - Data Mapping). However, area charts do not have the 2nd Series and Combo options. This is because the only combination available with area charts is a line.