In addition to the menu and the API, EspressReport ES also allows you to deploy charts using image URLs (Reports can also be deployed using URLs as described in Section 6.3 - Report URLs). Image URLs are http calls to the server that can either return a chart as a complete html page or return an image to be embedded in an existing Web page in an <img src> or <embed> tag (SVG/PDF). You can use an URL to call a pre-defined chart (.cht file) or chart template (.tpl file), or to create a chart using default appearance properties. Parameters entered into the URL can control various chart properties.
The easiest way to generate image URLs for your Web pages is to have the Organizer do it for you. To generate an image URL in the Organizer, first select the chart file (.cht or .tpl) that you would like to use. Then you can select Generate Image URL from the Publish menu, click the button on the toolbar, or right-click and select Generate Image URL from the pop-up menu. A dialog will appear prompting you to specify some of the attributes for the generated image.
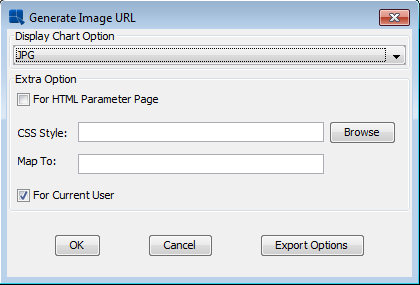
Image URL Options Dialog
The first option in the dialog allows you to select the export format for the chart - GIF, JPEG, PNG, PDF, SWF (Flash), or SVG. If the chart contains parameters, you will see the options for the HTML Parameter Page (shown above). Unchecking the button will prompt viewers to login first in order to view the chart. You can set additional export options by clicking the button. This will bring up a new dialog with several options for the different chart formats.

Export Options Dialog
Options in this dialog allow you to set the JPEG quality. The higher the quality setting, the larger the generated image. You can also set PNG compression and whether to make the exported GIF image transparent. The export method allows you to select either the frame or buffer method for generating the chart. Each method can result in faster performance depending on the system, size of the generated image, and number of data points in the chart. You can also enable and configure Flash animation if the image depiction should be animated. The last option allows you to specify the image size. You can specify the image size in pixels, or select default size. Clicking Use Default Size causes the image to be the same size as the chart canvas.
If your chart is parameterized, then there are two ways in which the chart can be run. You can either pass parameters directly into the URL as arguments, or have the URL generate a parameter prompt. If the chart contains parameters, then several options will appear in the image URL options dialog as pictured above. To generate an HTML parameter prompt check the For HTML Parameter Page option.
If you elect to generate a parameter prompt, you can also specify a CSS file to use to format the prompt. The dialog has options allowing you to specify the file and http path to the CSS file (An example of a parameter page CSS file is available under <ERESInstallDir>/help/examples/URL).
If you elect not to generate a parameter prompt, a dialog will open asking you to select parameter values which will be added as arguments to the generated URL.
For information on running the chart URL, see Section 6.2.1.3 - Running Image URLs.
Checking this option will embed the current user in the URL. If you uncheck this option, the user will be re-directed to a login page before viewing the chart.
User Login Dialog
By default, the URL will redirect to the login page under the ERES context (i.e. http://machinename:port/ERES. If you have deployed ERES in a different context, you can use the JSPCONTEXT parameter to pass in a different location.
Once you finished specifying options for the image URL, a new dialog will open containing the generated URL string. If you're running Organizer as an applet, then the URL will load in a new browser window (allowing you to copy and paste).

Generated URL
Image URLs can be run in one of two ways. The image URL can either generate a whole (HTML) page containing the generated chart or it can be used to stream the chart image into an existing page via an image tag (i.e. <img src="ImageURL">). To generate the chart as a complete page you need to add the following parameter to the URL: EmbedImageTag=true. In addition if the URL re-directs to the login page (no username and password supplied) or if you elect to generate a parameter prompt for the chart, then it will be returned in a complete page.
To embed the chart in an existing page, you must pass an username and password in with the URL or have it retrieve user information from the session (unless you're creating a new chart with the URL) and pass any parameter values into the chart in the URL.
Rather than having the Organizer generate the image URL, you can write your own. You can use an existing chart or template file, or you can generate a chart on the fly using default properties. You can control various chart attributes using URL parameters. You can also modify an URL generated by the Organizer.
The syntax for image URLs is fairly simple. Every URL begins with a call to the Server: http://<machinename>:<port>/<context>/LookupServlet?. The machinename is either the URL, machinename, or ip address of the server machine. The port is the port number for the application server, the default Tomcat for instance uses port 8080. The context is the context for the ERES servlets. By default, the context is ERES/servlet/, but this can be changed by the administrator. Following the question mark users need to specify whether the URL will return a chart or report using the URLTYPE parameter. Following the URLTYPE users can add parameters to the URL. Parameters are separated by the “&” character.
The following structure will generate a simple column chart in a Web page.
<img src="http://<machinename>:<port>/<context>/LookupServlet?
URLTYPE=FORCHART&MainTitle=Sample+Chart&ChartType=Column&CategoryName=A;B;C
&ChartData=series1;5;6;7&DisplayType=GIF&Width=400&Height=300">
For example, if the server was set up on www.quadbase.com with port 8080 and the context is ERES/servlet/, then the image tag should look like this.
<img src="http://www.quadbase.com:8080/ERES/servlet/LookupServlet?
URLTYPE=FORCHART&MainTitle=Sample+Chart&ChartType=Column&CategoryName=A;B;C
&ChartData=series1;5;6;7&DisplayType=GIF&Width=400&Height=300">
Generated Chart
As you can see, this URL generates a column chart with three points on the category (X) axis, and three data points in 1 series on the value (Y) axis.
In order for an URL to run, you must at minimum specify a chart or template file, or specify data, either directly within the URL or using a file or database. Also any input parameter string should use the “+” character in place of a space. An actual space character may disrupt the creation of the image file.
The same URL could be used to generate a Web page with the chart embedded. Simply add the following parameter to the end: EmbedImageTag=true. Then the URL can be used as a direct link, and doesn't need to be included in an existing Web page.
URL parameters allow you to specify which chart or template file to use, as well as data or data source information, and chart appearance such as chart type and image dimensions.
Login parameters allow you to pass username and password into image URLs. A login is required if the URL references a chart or template file (using the ChartPath or TemplatePath parameters). If login information is not specified in the URL, then the URL will re-direct to a login page before showing the chart.
- USERNAME:
This allows you to specify an username. If you generate an URL in Organizer and elect to use an user, the username will be encoded in the generated URL. You can also specify the username as plain text.
&USERNAME=user- PASS:
This allows you to specify the user password. If you generate an URL in Organizer and elect to use an user, the password will be encoded in the generated URL. The password can also be specified using plain text.
&PASS=password- USESESSION:
This allows you to have the server read the username and password from the session. If this option is enabled the information will be retrieved from session parameters
USERNAMEandPASS. This option is only available if you will be deploying the URL within a servlet or JSP application.&USESESSION=true- JSPCONTEXT:
This allows you to specify the location (context) of the ERES installation. This location is used when the URL re-directs to the login page. The default value is
/ERES, and the URL will work without setting this parameter in most deployments. You only need to specify this parameter if ERES is deployed in a context of a different name.&JSPCONTEXT=/MyReports
- TemplatePath:
This allows you to specify the
.tplor template file that you would like to use to create the chart. Because the.tplformat is saved without data, you can specify different data when using templates. If you do not specify different data ERES will try to reload data from the template's original source.&TemplatePath=http://machinename:port/ChartFiles/templatefile.tplIf USERNAME and PASSWORD is not provided, a login screen will appear prompting for one. If the user provided does not have permission for the template, a chart will not appear.
![[Note]](../../../images/note.png)
Note You can use both absolute and relative paths for the template file location.
- ChartPath:
This allows you to specify the
.chtor chart file that you would like to use to create the chart. Because the.chtfile is saved with the chart data, you cannot specify different data when using chart files.&ChartPath=http://machinename:port/ChartFiles/chartfile.chtNote You can use both absolute and relative paths for the chart file location. If either a chart or template file is specified in the URL, then a login is required to access the file.
- DataFilePath:
This allows you to specify a data file that will be used to plot the chart, either text or XML. For more on data file specifications, please see Section 2.4.5 - Data from Text Files.
&DataFilePath=http://machinename:port/chartdata.txtNote You can use both absolute and relative paths (relative to ERES installation directory) for the data file location.
From XML files you can use only those, that are in Quadbase format ( please see Section 2.4.4 - Data from XML and XBRL Files).
- DataSourceClass:
This allows you to specify a class file that will retrieve data to plot the chart. For more on using class files please see Section 2.4.6 - Data from Class Files.
&DataSourceClass=package.class- DBSourceInfo:
This allows you to specify a database and SQL query to be used to retrieve chart data. The parameter takes five input values:
database URL, database driver, username, password,andquery. Each input value is separated by a semi-colon. For more on connecting to a database, please see Section 2.4.3 - Data from a Database.&DBSourceInfo=url;driver;username;password;queryIf you do not wish to enter an
usernameorpassworduse the space character “+” instead. Do not drop the input value. The parameter will not run with insufficient inputs. In your SQL statement be sure to substitute the “+” character for any spaces. Also, substitute the wordequalorequalsfor the “=” sign.- QueryParamName:
This parameter is used if the chart or template file you're using contains a parameterized query. QueryParamName specifies the name of the query parameter you will be supplying a value for. (Parameter names are assigned when you initialize a query parameter. For more on this, see Section 2.4.3.2.2 - Parameterized Queries) It is always followed by the
QueryParamSize, and theQueryParamValueparameter.![[Caution]](../../../images/caution.png)
Caution You must specify all query parameters (or none of them), else your chart will not be displayed.
&QueryParamName=customerID&QueryParamSize=1&QueryParamValue=4- QueryParamSize:
This parameter is used to specify the number of values that will be passed into a particular chart parameter. As detailed in Section 2.4.3.2.2.1 - Multi-Value Parameters, some queries can have multi-value parameters. This URL parameter allows you to specify if the parameter (indicated by the previous
QueryParamNameparameter) takes multiple values. This parameter is always followed by one or moreQueryParamValuearguments for each of the paramater values for a particular parameter. If you do not specify this parameter then it will assume that the number of values to be passed in is one.- QueryParamValue:
This parameter is used if the chart or template file you're using contains a parameterized query.
QueryParamValuespecifies the value that you would like to pass to the query parameter specified by theQueryParamNameargument. For multi-value parameters a separateQueryParamValueargument must be supplied for each distinct parameter value that you're passing in. For more on creating parameterized charts, please see Section 2.4.3.2.2 - Parameterized Queries.- ColumnMapping:
If you have specified a data source for the generated chart, this argument allows you to map columns from your data file, or database query result set to the chart. Column mapping is specified using index values. Index values are assigned based on the order they appear in your data file from left to right, or the order in which they are selected in your SQL statement. Index values start with
0, so the first column is0and the second is1, etc. To perform column mapping, specify the column index for the respective axes for the chart. If you do not want to map one of the axes use the value-1. Do not leave it blank. Mapping varies for different chart types.Caution You must specify this parameter along with
DataFilePathparameter for proper chart generation.For Scatter, Surface, and Bubble Charts:
&ColumnMapping=series;xvalue;yvalue;zvalue;subValueFor High-Low, and HLCO Charts:
&ColumnMapping=series;category;high;low;open;close;subValueFor Gantt Charts:
&ColumnMapping=series;category;end;start;-1;-1;subValueFor all other chart types:
&ColumnMapping=series;category;sumby;value;subValueFor more detailed information about column mapping for all chart types, please see Section 3.13.1 - Data Mapping.
- TransposeData:
This is a Boolean flag that denotes whether the data is to be transposed or not. It is followed by the
SelectTransposeparameter which dictates which columns to transpose. By default this is false.&TransposeData=true- SelectTranspose:
This allows you to specify the columns that you would like to transpose. To select columns, specify the column indices separated by a semi-colon. If you do not specify any columns then all of them will be transposed.
&SelectTranspose=ColumnIndex;ColumnIndex…For an explanation of how data transposition works, please see Section 2.4.2.1.1 - Transposing Data.
- ChartData:
This parameter allows you to supply data for the chart within the URL string. The
ChartDataparameter specifies the data points and series for the chart. It is generally used in conjunction with theCategoryNameparameter which specifies the individual category names for the data points, and theDataTypeparameter which specifies that data type for your chart data. Stack-type charts with a sum by value, can have the sum by names specified using the SumbyName parameter.The structure of the
ChartDataparameter is a series name followed by data points. Each series is separated by the | character, and each data point is separated with a semi-colon. For chart types that require more than one value per data point, the sub-values are separated by a comma. The following examples illustrate how theChartDataparameter is used for various chart types.For Column, Bar, Area, Line, Pie, and Dial charts, the structure resembles the following:
&ChartData=seriesA;5;3;2|seriesB;2;5;8|seriesC;1;2;3
&CategoryName=morning;afternoon;night&DataType=integer
This generates a chart that has three series,
seriesA,seriesB, andseriesC. The chart also has three integer data points,morning,afternoon, andnightwithin each of the series.For Stack Column Stack Bar, Stack Area, and Percent Column charts the
SumbyNameparameter has to be specified in addition to theCategoryNameandDataTypeparameters. The structure for these charts resembles the following:&ChartData=storeA;1,3,5,3;2,5,9,10|storeB;2,6,2,8;3,7,6,8 &CategoryName=weekday;weekend&SumbyName=deli;drinks;bread;cookies &DataType=integer
This generates a chart with two series,
storeA, andstoreB, which have two respective points. The individual data points have four sum by segments separated by a comma.For Bubble, Scatter and Surface Charts, the
ChartDataparameter value structure is similar to that of the Stack-type charts, however, rather than using theCategoryNameparameter for the categories, it usesCategoryLength, an integer value that specifies the maximum length of the series. The structure resembles the following:&ChartData=groupA;2,5,3;4,6,1;1,6,8;8,9,2| groupB;1,9,4;7,4,3;9,2,6;2,1,2&CategoryLength=4&DataType=integer
For Surface charts, there are some additional restrictions. First, surface charts cannot contain more than one series. Second, each data point must be of the format
x,z,y,thexandzvalues signify the position on the horizontal plane, while theyvalue determines the height. And finally, every uniquexvalue must be paired with every uniquezvalue, for example the following is an acceptable data set0,1,5; 0,2,6; 0,3,5; 1,1,5; 1,2,6; 1,3,5Every unique
xvalue (0and1) were paired with every unique z value (1, 2and3). While the following data set is not acceptable0,1,2; 0,2,4; 0,3,2; 1,1,2; 1,3,2because when
x = 1, there is no correspondingzvalue which equals2. Also note that there is no restriction on theyvalue. It is not necessary to use theCategoryLengthparameter since there can only be one series, for example:&ChartData=A; 0,0,0;0,1,0;0,2,0;0,3,0;0,4,0; 1,0,0;1,1,0;1,2,0;1,3,0;1,4,0; 2,0,0;2,1,0;2,2,1;2,3,0;2,4,0; 3,0,0;3,1,0;3,2,0;3,3,0;3,4,0; 4,0,0;4,1,0;4,2,0;4,3,0;4,4,0Yields the following graph:
For two-dimensional Scatter Charts, each data point has two sub data points. All other charts have three sub data points separated by a comma. In addition, if the number of data points is not the same for all series, the maximum number of data points in a series must be specified. Use the
CategoryLengthparameter to specify the maximum number of data points, for example:&ChartData=Trial1;3,1;8,2;20,5;40,10;60,25| Trial2;6,1;10,1;21,3;28,6;39,11;54,17;65,29 &CategoryLength=7
For HLCO, High-Low, and Gantt Charts, the ChartData parameter specification is similar to that of the Stack-type charts. For HLCO Charts, 4 sub data points within each individual data point specify the
High, Low, Open,andClosevalues. For High-Low Charts, 2 sub data points specify theHigh, andLowvalues. For Gantt Charts, 2 sub data points specify theStartandEndvalues. TheChartDatastructure resembles the following:&ChartData=priceA;7,2,3,5;19,5,11,9;15,8,9,8 &CategoryName=day1;day2;day3&DataType=integer
This data generates a HLCO chart with 1 series
priceA, and three integer data pointsday1, day2,andday3. Each data point has aHigh, Low, Open,andClosevalue.For more information about the various chart types, and data mapping, please see Section 3.13 - Chart Types and Data Mapping.
- CategoryName:
This parameter allows you to specify the individual category names of the data points. Each category name is separated by a semi-colon. The data points are specified within the
ChartDataparameter.&CategoryName=day1;day2;day3…- CategoryLength:
This parameter allows you to specify the maximum length of the series in scatter, and bubble charts. The argument is specified as a single integer. This needs to be specified when the individual series are not the same length. If
CategoryLengthis not specified, then the chart will be plotted assuming that the series length is never longer than the first series specified. Hence, if the second series is longer than the first, the additional data points will not be plotted unless theCategoryLengthparameter is used.&CategoryLength=4- SumbyName:
This parameter allows you to specify the individual sumby names for the data points. This parameter is used when you're entering data for Stack-type charts.
&SumbyName=deli;drinks;bread;cookies…- DataType:
This parameter allows you to specify the type of data values that are used by the chart. The default type is
float. The arguments that can be specified for this parameter areint, integer, float, double, boolean, date, time,andtimestamp. The values are not case sensitive.Date, time,andtimestamptypes can only be used for Gantt charts.&DataType=integerNote DataTypeis only specified for the value axis. You can use different types of data for the category axis, however they are all treated as strings. To use numeric, or date data without having it converted to string, design the chart using a database or data file.
- MainTitle:
This allows you to specify the main title of the chart. By default, the chart has no title. However, if you're using a template file the titles will carry over, unless you specify different titles using these parameters.
&MainTitle=Sample+Chart- XTitle:
This allows you to specify the X-axis title.
&XTitle=Time+of+Day- YTitle:
This allows you to specify the Y-axis title.
&YTitle=Sales- ZTitle:
This allows you to specify the Z-axis title.
&ZTitle=seriesA- Width:
This allows you to specify the width of the generated image in pixels. If you do not specify a width, then the image will have the same width as the chart canvas.
&Width=400- Height:
This allows you to specify the height of the generated image in pixels. If you do not specify a height, then the image will have the same height as the chart canvas.
&Height=444- FitOnCanvas:
This is a Boolean flag that will cause the chart (not including labels, legend, etc.) to be shrunk and/or repositioned to fit on the canvas. By default, this is
false.&FitOnCanvas=true- ChartRelativePosition:
This allows you to specify the X and Y position of the lower left-hand corner of the chart to the lower left-hand corner of the chart canvas or image. The two arguments, numbers between 0 and 1 separated by a semi-colon, specify the X and Y positions respectively.
0;0places the chart at the lower left-hand edge of the image, and1;1places the chart at the upper right-hand edge. By default, the chart relative position is0.2;0.2&ChartRelativePosition=0.23;0.18- ChartRelativeSize:
This allows you to specify the size of the chart (relative width and height) relative to the chart canvas or image. The two arguments, numbers between
0and1separated by a semi-colon, specify the width and height respectively.1;1causes the chart to be the same size as the image, and0;0will have no chart. By default, the chart relative size is0.6;0.6.&ChartRelativeSize=0.63;0.7- ChartDimension:
This allows you to specify whether the chart is two-dimensional or three-dimensional. By default the chart is two-dimensional. The argument for this parameter is either
2Dor3D.&ChartDimension=3D- ChartType:
This parameter allows you to select which chart type to use. By default, a Column Chart type is used. The arguments for this parameter can be:
Column, Bar, Line, Pie, Area, Overlay, Box, Radar, Dial, StackColumn, StackBar, StackArea, PercentColumn, Scatter, Bubble, Surface, HLCO, HiLow,andGantt.&ChartType=StackAreaNote For Overlay, Box, and Radar charts, you can only open existing charts through the
ChartPathparameter, you will not be able to specifyChartDatafor these chart types.- 3DDrawMode:
This allows you to specify the way in which three-dimensional charts should be drawn. There are five options that are specified with an integer argument from
1to5.1draws the chart as a wire frame without filling in the surfaces.2draws a border around the chart frame.3draws a border and applies Gouraud shading.4draws the chart with Gouraud shading, but doesn't draw a border.5draws the 3D chart as standard (without borders or specialized shading). (This is also the default).&3DDrawMode=2For more information about three-dimensional rendering options, see Section 3.14.4 - The Navigation Panel.
- DisplayType:
This parameter allows you to select the image format in which you would like to render the chart. Options are
GIF, JPG, PNG, PDF,andSVG. The default type isJPG.&DisplayType=GIFNote If you're generating a parameter page for the chart (see Section 6.2.2.2.5 - Parameter Page Parameters) you can specify this argument more than once in an URL to give the user a drop-down list from which to select the image format. If you specify more than one format without generating a parameter page, the chart will be generated using the format specified in the first argument.
- ExportOnServer:
This is a Boolean flag that allows you to specify whether the chart should be written as a file on the server-side, or streamed back to the client. If this argument is set to
true, then theExportPathargument should also be used to indicate where the file should be written.&ExportOnServer=true&ExportPath=C:\ERES\ExportFiles\chart.gif- ExportPath:
This allows you to specify a file path to export the chart to. This argument should always be used with the
ExportOnServerargument. When a file path is specified, the chart will be exported in the selected format to the server-side.Caution When using ExportPath parameter and the file with the same name already exists, it is replaced without any warnings.
- UseBuffer:
This is a Boolean flag that allows you to specify if the image buffer is used.
&UseBuffer=true- ExportMethod:
This allows you to specify which of the two available image generation methods the server should use. You can specify either
Bfor the buffer method orFfor the frame method. Each method can result in faster performance depending on the system, the size of the generated image, and the number of data points in the chart.&ExportMethod=B- GIFTransparent:
This is a Boolean flag that allows you to set the background of generated GIF images transparent. This parameter only works if the display type is set to
GIF.&GIFTransparent=true- PNGCompression:
This parameter allows you to specify the compression of PNG images. The lower the compression is set, the faster the file will be generated. Lower compressions produce much larger files. There are four compression settings that can be specified using an integer argument.
0is default compression. This level is the mid-level compression.1is fast compression. This generates the PNG file with minimal compression, causing fast file generation with a fairly large file.2is maximum compression. This generates a fully compressed PNG file, causing the file to be very small, but taking more generation time.3is zero compression. This generates a PNG file without any compression. It is generated very quickly, but has a very large file size.&PNGCompression=1- JPEGQuality:
This parameter allows you to specify the quality of generated JPEG images. As quality increases, so does the generated file size. The argument for this parameter is an integer between
1and99.1is minimum quality, and99is the maximum. By default the quality is set to99.&JPEGQuality=99
- ForHTMLParamPage:
This is a Boolean flag that indicates whether or not to return a parameter page instead of a chart. This option only works it the chart contains query parameters. If this argument is set to
truethen the URL will return the parameter page, and ignore any parameter values passed into the URL. By default this argument will befalse.&ForHTMLParamPage=true- ParamPageCssStyle:
This allows you to specify a CSS file to format the generated parameter page.
&ParamPageCssStyle=http://machinename:port/files/ParamPage.cssNote You can use both absolute and relative paths to the CSS file.
- ParamPageTitle:
This parameter allows you to specify a title for the parameter page.
&ParamPageTitle=Select+Chart+Options- ParamPageTitleFontName:
This parameter allows you to specify the font to use for the parameter page title.
&ParamPageTitleFontName=Arial- ParamPageTitleFontSize:
This parameter allows you to specify the font size for the Parameter page title. The size is specified as HTML size (i.e.
<font size=3>) rather than point size. It ranges from1to7, where1is the smallest and7is the largest.&ParamPageTitleFontSize=5- ParamPageTitleFontStyle:
This allows you to apply a font style to the text of the parameter page title. The style is specified as an integer from
0 - 3. The numbers indicate the following styles:0- Plain,1- Bold,2- Italic,3- Bold + Italic.&ParamPageTitleFontStyle=1- ParamPageTitleFontColor:
This parameter allows you to specify the font color for the parameter page title. The color is specified with a six digit hexadecimal number like in HTML.
&ParamPageTitleFontColor=404040- ParamPageTextFontName:
This parameter allows you to specify the font to use for the prompt text in the parameter page.
&ParamPageTextFontName=Arial- ParamPageTextFontSize:
This parameter allows you to specify the font size for the Parameter page prompt text. The size is specified as HTML size (i.e.
<font size=3>) rather than point size. It ranges from1to7, where1is the smallest and7is the largest.&ParamPageTextFontSize=3- ParamPageTextFontStyle:
This allows you to apply a font style to the parameter page prompt text. The style is specified as an integer from
0 - 3. The numbers indicate the following styles:0- Plain,1- Bold,2- Italic,3- Bold + Italic.&ParamPageTextFontStyle=0- ParamPageTextFontColor:
This parameter allows you to specify the font color for the parameter page prompt text. The color is specified with a six digit hexadecimal number like in HTML.
&ParamPageTextFontColor=000000- ParamPageBorderThickness:
This parameter allows you to specify the thickness of the border drawn around the prompts in the parameter page. The thickness is specified in pixels. Specifying
0will draw no border around the prompts.&ParamPageBorderThickness=1- ParamPageBorderColor:
This parameter allows you to specify the color for the border drawn around the prompts in the parameter page. The color is specified with a six digit hexadecimal number like in HTML.
&ParamPageBorderColor=C6C6C6- ParamPageTableBackgroundColor:
This parameter allows you to specify the background color for the table containing the prompts in the parameter page. The color is specified with a six digit hexadecimal number like in HTML.
&ParamPageTableBackgroundColor=FFFFFF- ParamPageAlignment:
This parameter allows you to specify the alignment in the page for the table containing the prompts. Options are
LEFT,RIGHT, andCENTER. The default alignment isCENTER.&ParamPageAlignment=LEFT- ParamPageLayout:
This parameter allows you to specify the layout of the parameter page. You can either align the parameter prompts vertically (default) or horizontally. The options for this parameter are
HORIZONTALandVERTICAL.&ParamPageLayout=HORIZONTAL- ParamPageResetEnabled:
This is a Boolean flag that allows you to show/hide the reset button for the parameter form. By default the button is shown.
&ParamPageResetEnabled=false- ParamPageOuterBorder:
This is a Boolean flag that allows you to draw only the outer border for the parameter prompt table. This parameter will have no effect if the border thickness is set to zero.
&ParamPageOuterBorder=true
The following examples are sample image URLs that use one or more of the parameters listed in the preceding section. To use these, simply change machinename to your host name, port to the server port that you are using, and context to your servlet context. Note also that these examples all use the EmbedImageTag parameter to return a whole Web page containing the chart. If you want to use these examples in an existing Web page, set this parameter to false.
These URL examples are also included in a file named ImageURL.txt under help/examples/URL.
Example 1: Query data from a database, and plot a column chart
This example uses the Woodview HSQL database that is included with the ERES installation under help/examples/DataSources/database. To run this example you will need to have the HSQL JDBC driver in your classpath.
http://machinename:port/context/LookupServlet?URLTYPE=FORCHART
&DBSourceInfo=jdbc:hsqldb:help/examples/DataSources/database/woodview;
org.hsqldb.jdbcDriver;sa;+;select+c.categoryname+as+category,+
p.productname+as+product,+p.unitsinstock+as+units,+p.unitprice+
as+price+from+categories+c,+products+p+where+c.categoryid+equal+
p.categoryid+and+c.categoryid+equal+'SIC'&ColumnMapping=0;1;-1;2;3
&ChartRelativePosition=0.1;0.1&Width=420&Height=320
&EmbedImageTag=true&DisplayType=GIF
The query retrieves four columns from the database. The UnitPrice column is plotted as a sub-value which is the line. Note that the third argument in the ColumnMapping parameter is a -1. This is because column charts have no Sumby mapping.
Example 2: Draw data from a text file, and plot a 3D pie chart
This example draws data from the sample.dat file which is located in the help/examples/DataSources/text directory under the server root. You may need to modify the URL for the text file depending on how you have ERES deployed.
http://machinename:port/context/LookupServlet?URLTYPE=FORCHART
&DataFilePath=http://machinename:port/ERES/help/examples/DataSources
/text/sample.dat&ColumnMapping=-1;1;-1;4;-1&ChartType=Pie
&ChartDimension=3D&3DDrawMode=2&ChartRelativePosition=0.1;0.2;
&ChartRelativeSize=0.7;0.7&Width=420&Height=320
&EmbedImageTag=true&DisplayType=GIF

Since pie charts only have category, and value mappings, the column mapping uses -1 for the series, sum by, and sub-value mappings. The 3DdrawMode parameter is used to specify a border around the chart frame.
Example 3: Create a 3D Bar Chart, and add chart titles
This example uses the ChartData parameter to pass data within the URL string into the chart.
http://machinename:port/context/LookupServlet?URLTYPE=FORCHART
&ChartData=Store+1;500;300;200;800|Store+2;200;500;200;300|
Store+3;100;200;300;100&CategoryName=Mar,+2000;Jun,+2000;Sep,+2000;
Dec,+2000&DataType=integer&ChartType=Bar&ChartDimension=3D
&ChartRelativePosition=0.3;0.22&ChartRelativeSize=0.50;0.50&Width=420
&Height=320&MainTitle=Sales+For+2000&YTitle=Quarter
&XTitle=Sales+(Thousands)&ZTitle=Store&EmbedImageTag=true
&DisplayType=PNG
The chart is a 3D chart, which by default plots the series on the Z axis. X, Y, and Z axis labels have been added, as well as the chart title.
Example 4: Use a template file to apply appearance properties to a new data set
This example uses the Example4.tpl file which is included in the help/examples/URL directory of the ERES installation. Because this example includes an existing file, security roles apply. To run this example, you will need to add this file in the Organizer (see Section 2.1.4.1 - Adding and Modifying Files) and set privileges for it (see Section 2.3.2 - Setting User Privileges).
The URL includes the USERNAME and PASS parameters. You can either supply these parameters, or remove them. If they're removed, you will be re-directed to the login page before viewing the chart.
http://machinename:port/context/LookupServlet?URLTYPE=FORCHART
&USERNAME=username&PASS=password&TemplatePath=http://machinename:port
/ERES/help/examples/URL/Example4.tpl&ChartData=Store+A;4;8;16;10|
Store+B;17;9;6;7&DataType=Integer&CategoryName=Computer;Printer;
Monitor;Mouse&ChartType=Area&EmbedImageTag=true&DisplayType=PNG
As you can see, the template file has applied all of the appearance properties, including many that cannot be controlled using an Image URL. You main need to modify the URL for the template file depending on how you have ERES deployed.
Image URL parameters can only control some of the chart properties, and most of the properties are displayed using default values. For greater control over the appearance of the chart, you should create a chart or template file using the Chart Designer, and then call or apply that file with an image URL.